
Algorithmic Trading for Beginners: Start Without Code

Algorithmic trading means using a set of computerized rules to place trades automatically, without manual intervention. If you’re new to this, here are the three things to do right now:
- Learn core market concepts first. Understand how orders work (market, limit, stop), what bid-ask spread means, and how price data is structured. Khan Academy’s finance section and Investopedia’s trading basics are free starting points.
- Pick a sandbox before risking money. Open a paper trading account (most U.S. brokers offer one free) or sign up for a no-code platform like Quantgenie where you can build and test strategies without writing a line of code.
- Build one simple rule-based strategy. Not five. One. A moving-average crossover is the classic first choice: buy when the 10-day average crosses above the 50-day, sell when it crosses back below.
Your 24–72 hour checklist: open a brokerage paper account, read one introductory resource on algorithmic trading basics, and write your first strategy in plain English before touching any code or platform.
Table of Contents
- What beginner-friendly strategies actually look like
- What you actually need to run and test algo strategies in the U.S.
- How to backtest correctly and protect your capital
- Key Takeaways
- What I’d tell every beginner who’s about to start
- Quantgenie makes the first strategy the easiest part
- Useful sources for learning more
What beginner-friendly strategies actually look like
The Oxford Algorithmic Trading programme frames systematic trading as a blend of finance theory and practical system design, covering everything from momentum models to volatility scaling. For beginners, the goal is not to replicate that sophistication. The goal is to learn the workflow using a strategy simple enough to understand completely.
| Strategy | Core idea | Data required | Beginner complexity | Time horizon | Main pitfall |
|---|---|---|---|---|---|
| Moving-average crossover | Buy/sell when a fast MA crosses a slow MA | Daily OHLCV | Low | Swing (days–weeks) | Whipsaws in sideways markets |
| Mean reversion (RSI/Bollinger) | Buy oversold, sell overbought conditions | Daily OHLCV + indicator | Low–Medium | Swing | Works until a trend breaks it |
| Time-series momentum | Buy assets trending up over 1 month | Monthly returns | Medium | Swing–Position | Drawdowns during reversals |
| VWAP/TWAP execution | Slice a large order across time to minimize market impact | Intraday tick or minute data | Medium | Intraday | Requires intraday data feed |
| Simple pairs concept | Trade the spread between two correlated assets | Daily OHLCV for 2 assets | Medium–High | Swing | Correlation breaks down |
Moving-average crossover pseudocode (plain English):
Every day at market close:
  Calculate 10-day simple moving average of closing price
  Calculate 50-day simple moving average of closing price
  If 10-day MA > 50-day MA AND position is flat → BUY 1 unit
  If 10-day MA < 50-day MA AND position is long → SELL all
Mean reversion pseudocode:
Every day:
  Calculate 14-day RSI
  If RSI < 30 AND position is flat → BUY 1 unit
  If RSI > 70 AND position is long → SELL all
A few practical rules for choosing your first strategy:
- Keep parameters to 2–3 at most. Every additional parameter is another opportunity to overfit.
- Prefer daily data over intraday data to start. Intraday data is messier, more expensive, and harder to backtest correctly.
- Pick a strategy you can explain in two sentences. If you can’t, you don’t understand it well enough to trust it live.
Multiple beginner guides converge on the moving-average crossover not because it’s reliably profitable, but because it teaches the complete development and validation workflow without overwhelming complexity.
What you actually need to run and test algo strategies in the U.S.
The barrier to entry is lower than most people think. A motivated beginner with a laptop and a free brokerage API can have a simple strategy running in paper mode quickly. Getting it to work well takes months. Here’s the minimum viable toolkit:
- Brokerage account: — Choose a U.S. broker that offers a paper trading environment and an API or webhook. Alpaca (commission-free, REST API) and Interactive Brokers (more complex but powerful) are common starting points.
On cost: paper trading is free. A basic Python setup with free data costs nothing. Paid data subscriptions start around $20–$50 per month for reliable adjusted daily data. Live brokerage fees vary, but commission-free brokers have made the cost of execution nearly zero for retail traders.
Pro Tip: Before going live, run your strategy through at least one period of high volatility (a market crash or spike) in your backtest. If the max drawdown during that period would have wiped out your account or triggered a margin call, the strategy isn’t ready.
Investopedia’s overview of algorithmic trading highlights Python as the practical starting language for retail traders, given its libraries and brokerage SDK support. The Learn-Quant repository on GitHub offers 127 self-contained modules covering Python basics, data handling, and strategy implementations, all runnable and commented for beginners.
How to backtest correctly and protect your capital
Backtesting is where most beginners either build real confidence or fool themselves. The difference comes down to how honestly you model the real world.
The correct backtesting sequence:
- Get clean, adjusted historical data (accounting for splits and dividends).
- Implement your exact execution model: market orders fill at the next open, not the signal bar’s close.
- Add realistic slippage and commissions based on commonly used assumptions for liquid U.S. equities.
- Run a walk-forward test: optimize on one period, validate on the next, repeat.
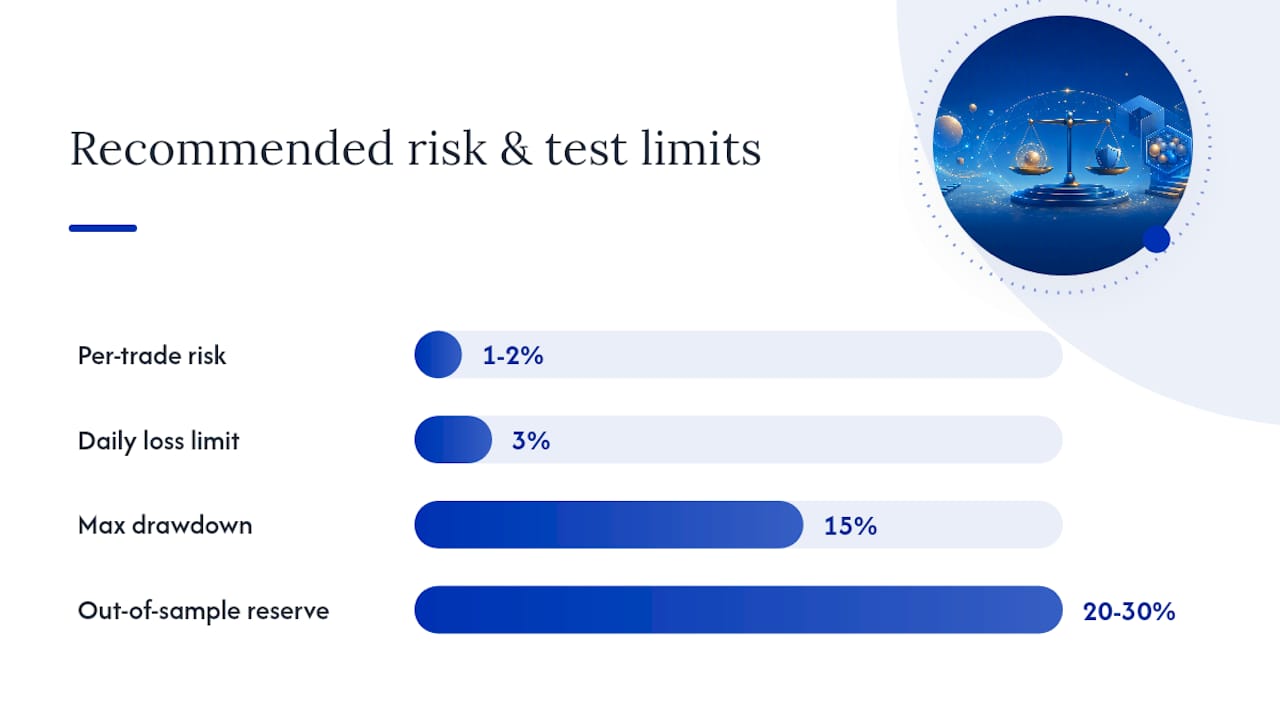
- Reserve at least 20–30% of your data as a final out-of-sample test you never touch during development.
Common errors that destroy backtest validity:
- Look-ahead bias: Using data in your signal that wouldn’t have been available at the time of the trade. This is the most common and most damaging error.
- Survivorship bias: Testing only on stocks that still exist today ignores the ones that went bankrupt, which inflates returns.
- Overfitting: Running hundreds of parameter combinations until something looks good. The result fits the past, not the future.
- Ignoring transaction costs: A strategy that trades daily with 0.5% slippage per round trip needs a very high gross return just to break even.
Key metrics and what they tell you:
- Sharpe ratio: Annualized return divided by annualized volatility. Above 1.0 is decent; above 2.0 is strong for a simple strategy. The Oxford programme uses Sharpe, Sortino, and Calmar as its core evaluation framework.
- Sortino ratio: Like Sharpe, but only penalizes downside volatility. Better for strategies with asymmetric return profiles.
- Max drawdown: The largest peak-to-trough loss. If you can’t stomach this number emotionally, the strategy isn’t right for you at that position size.
- Profit factor: Gross profit divided by gross loss. Above 1.5 is a reasonable target for a simple strategy.
- Win rate and expectancy: Win rate alone means nothing without knowing the average win vs. average loss size.
Mandatory risk controls before going live:
- Risk no more than 1–2% of total capital on any single trade.
- Set a daily loss limit (e.g., 3% of account) that automatically halts trading for the day.
- Define a max drawdown threshold (e.g., 15% from peak) that triggers a full stop and review.
- Set up monitoring alerts so you know immediately if your strategy stops placing orders or starts behaving unexpectedly.
Key Takeaways
Algorithmic trading for beginners succeeds when you start with one simple strategy, backtest it honestly with realistic costs, paper trade for at least a month, and deploy live only with strict position sizing and a kill-switch in place.
| Point | Details |
|---|---|
| Start with one strategy | A moving-average crossover teaches the full workflow without overwhelming complexity. |
| Backtest with realistic costs | Model slippage, commissions, and correct order fills before trusting any backtest result. |
| Paper trade before going live | Run at least 4–8 weeks of paper trading and compare results to your backtest projections. |
| Know your key metrics | Track Sharpe ratio, Sortino ratio, max drawdown, and profit factor before deploying capital. |
| Quantgenie removes the code barrier | Quantgenie translates plain-English strategies into deterministic algorithms with institutional-grade backtesting and broker integrations. |
What I’d tell every beginner who’s about to start
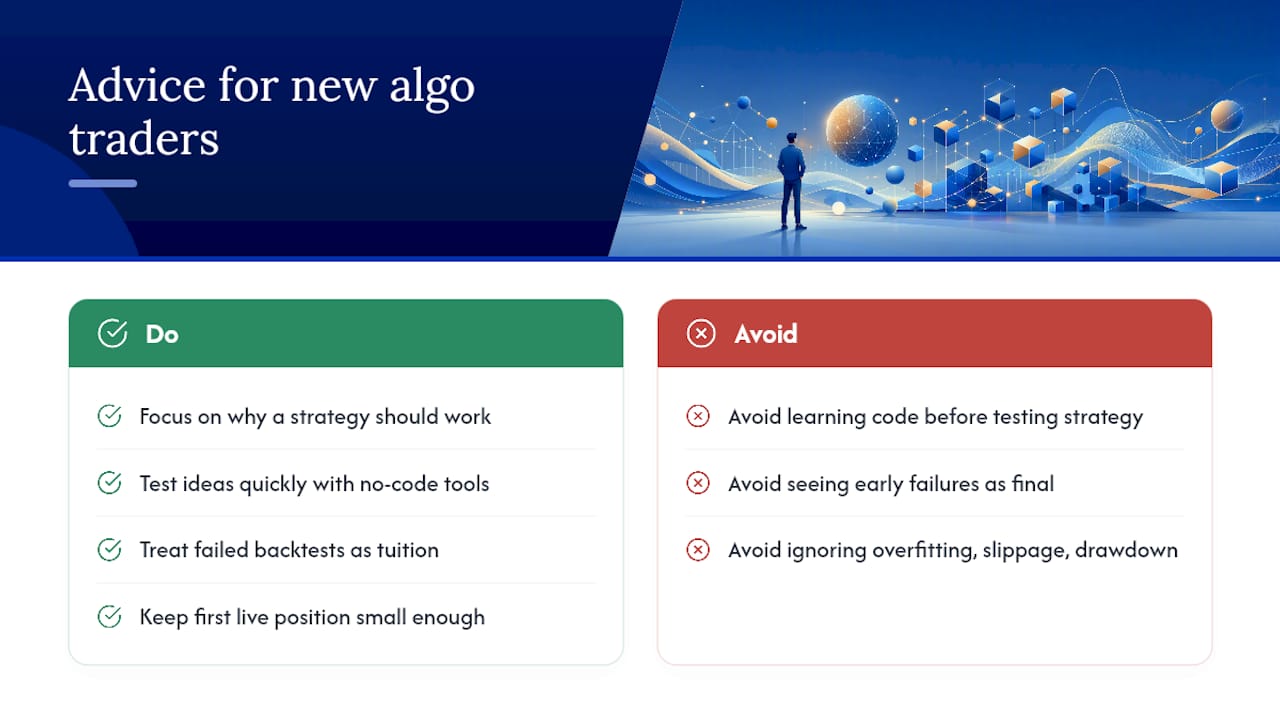
The conventional wisdom in algo trading education is to learn Python first, then learn finance, then build a strategy. That sequence works for some people, but it also causes a lot of beginners to quit before they ever test a single idea. The coding becomes the obstacle, not the strategy.
What actually matters early on is understanding why a strategy should work, not how to implement it in 200 lines of Python. A moving-average crossover built in a no-code tool and tested honestly across five years of data teaches you more about overfitting, slippage, and drawdown than a perfectly coded strategy you don’t fully understand.
The other thing most guides understate: early failure is not a sign you’re doing it wrong. Most first strategies don’t survive rigorous out-of-sample testing. That’s the point. Each failed backtest teaches you something about what the market actually rewards. The traders who stick around are the ones who treat those failures as tuition, not as evidence they should quit.
Keep your first live position small enough that a total loss wouldn’t change your month. That constraint forces discipline in a way that no amount of paper trading fully replicates.
Quantgenie makes the first strategy the easiest part
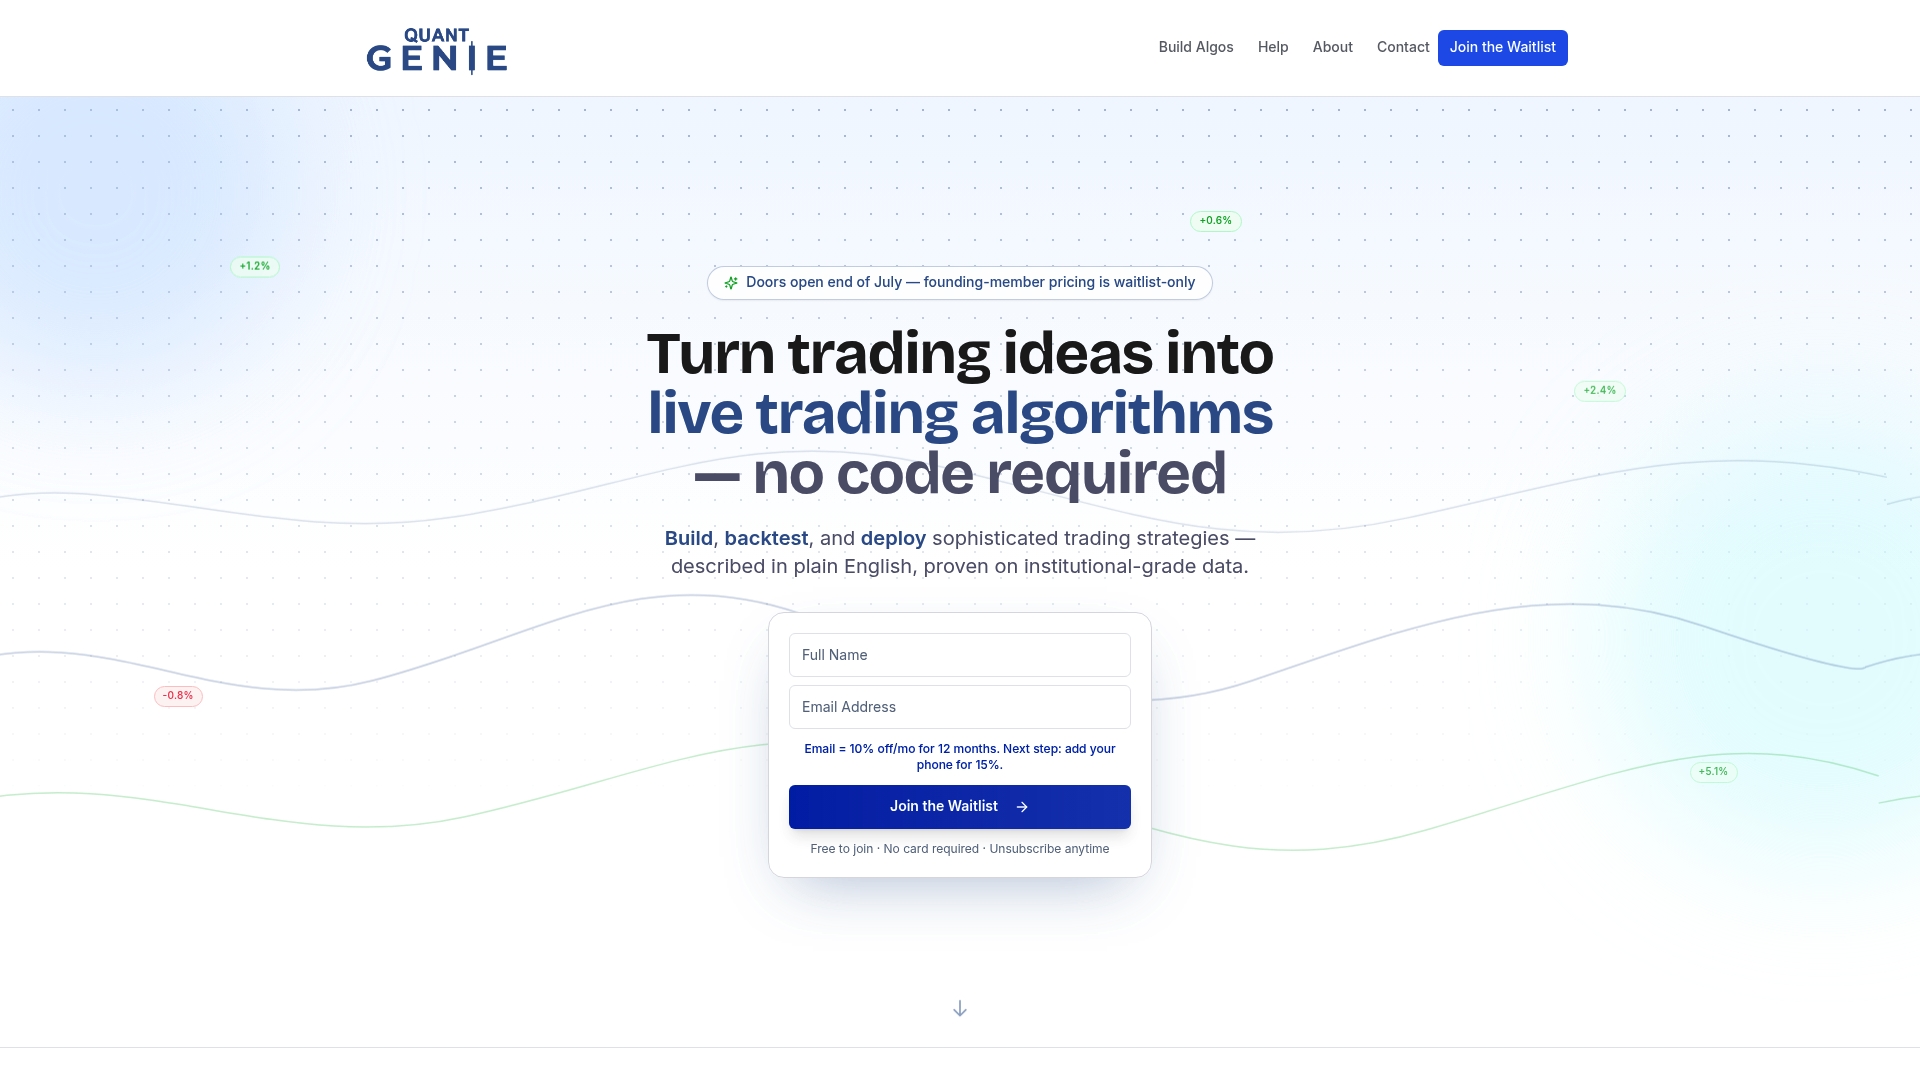
Most beginners spend weeks on setup before they test a single idea. Quantgenie cuts that to hours. You describe your strategy in plain English, and the platform builds a deterministic algorithm, runs it against institutional-grade historical data, and shows you the full performance breakdown: Sharpe ratio, Sortino, max drawdown, profit factor, and a visual trade log.
The backtesting engine models realistic slippage and commissions, so the numbers you see reflect what live trading would actually look like, not an idealized version of it. Built-in paper trading lets you validate execution before a single real dollar is at risk. When you’re ready to go live, direct broker integrations handle deployment without manual order copying.
For beginners who want to focus on strategy logic rather than software infrastructure, try Quantgenie’s build flow and run your first backtest today.
Useful sources for learning more
- Investopedia: Basics of algorithmic trading, concepts and examples
- FINRA
- SIPC
- Bloomberg: JPMorgan arms coders with trading licenses as quants push ahead
- Oxford Algorithmic Trading programme
- Learn-Quant — MeridianAlgo (GitHub)
- QuantInsti: Learn Algorithmic Trading — Steps, Skills & Career
- Algorithmic Trading for Beginners: Complete Guide | InvestingWithAI