
Survivorship Bias in Backtesting: A Trader’s Guide

Survivorship bias is the error of testing a strategy only against assets that still exist today, which inflates returns, shrinks apparent drawdowns, and makes a mediocre system look like a winner. Before you run another backtest, do three things: verify your universe uses point-in-time constituent lists, confirm your dataset contains delisting records, and plot universe size over time to spot sudden drops. Those three checks reveal the missing failures that make every other performance metric unreliable.
- Verify point-in-time constituents. Your universe at any historical date should reflect membership at that date, not today’s survivors.
- Check for delisting records. A dataset without
delisting_dateanddelisting_reasonfields is almost certainly pruned. - Plot universe size over time. A flat or rising count when markets were crashing is a red flag, not a good sign.
Table of Contents
- What is survivorship bias, and why does the Wald example matter?
- How does survivorship bias distort algorithmic backtests?
- How does survivorship bias enter your trading datasets?
- How do you detect survivorship bias in your backtest data?
- Step-by-step: how to remove survivorship bias from your backtests
- What should you demand from a data vendor?
- Common mistakes when correcting for survivorship bias
- A worked numerical example: the cost of excluding delisted stocks
- Your pre-deployment backtest checklist
- Key Takeaways
- The bias practitioners keep underestimating
- Quantgenie gives you survivorship-free backtests without the data headaches
- Useful sources and further reading
What is survivorship bias, and why does the Wald example matter?
Survivorship bias is a form of sampling bias: you analyze only the entities that made it through a filter and draw conclusions as if they represent the full original population. The classic illustration comes from World War II. Statistician Abraham Wald was asked where to add armor to returning bombers. The intuitive answer was to reinforce the areas showing the most bullet holes. Wald’s insight was the opposite: the planes that came back could absorb hits in those spots. The planes that never returned were hit elsewhere. Reinforcing the visible damage would have been exactly wrong.
The cognitive pull here is strong. Behavioral scientists Sendhil Mullainathan and Katy Milkman have noted that success stories dominate samples because failures disappear from view, not because they are rare. For traders, the parallel is direct: the strategies, funds, and stocks you can study are the ones that survived long enough to be studied.
How does survivorship bias distort algorithmic backtests?
When failed assets are missing from a dataset, every performance metric shifts in the optimistic direction:
- Overstated returns. Delisted stocks often end in bankruptcy or forced liquidation at steep losses. Excluding them removes the worst outcomes from the return distribution.
- Understated drawdowns. Maximum drawdown calculations miss the deep, sustained losses that delisted names would have contributed.
- Compressed volatility. Survivors tend to be less volatile than the full universe; pruning failures artificially tightens the return distribution.
- Inflated Sharpe and Sortino ratios. Both numerator (return) and denominator (risk) move in the wrong direction simultaneously.
- Overfitting and false causality. Strategies optimized on survivors may be overfit to attributes that winners and losers shared equally. Without the failures, you cannot test whether those attributes actually predicted anything.
The systemic risk is real. A portfolio strategy that looks robust on survivorship-pruned data may be overfit to a past that never existed in full, leaving it exposed to exactly the tail events it was never trained to handle.
How does survivorship bias enter your trading datasets?
The most common entry point is a dataset built from current index membership. Using today’s S&P 500 constituents to backtest a dividend strategy back to 1990 silently includes companies that grew into the index later and excludes companies that were removed for poor performance. The index looks like it always held winners because it does now.

Vendor feeds compound the problem. Many data providers prune delisted assets from their default exports to reduce file size or simplify delivery. Mutual fund databases carry the same flaw: funds that closed or merged are often absent, which is why a fund family’s surviving lineup can appear to have outperformed its peer group even when the closed funds dragged the true average down.
Corporate actions introduce a subtler version. If split adjustments, merger ratios, and dividend reinvestment are applied using today’s corporate-action logs rather than point-in-time records, prices for assets that later merged or spun off can be reconstructed incorrectly, effectively rewriting history.
Pro Tip: Before trusting any vendor feed, query for these specific fields: delisting_date, delisting_reason, snapshot_timestamp, and membership_start / membership_end. If any are absent or null across a significant portion of your universe, treat the dataset as survivorship-pruned until proven otherwise.
How do you detect survivorship bias in your backtest data?
Run these diagnostics before you interpret a single performance number:
| Diagnostic | What to compute | Warning signal |
|---|---|---|
| Survival curve | Active constituent count by month | Flat or rising count during known market stress periods |
| Universe size over time | Total assets in universe per rebalance date | Sudden drops unrelated to strategy filters |
| Delisting rate by year | Delistings / total assets per calendar year | Near-zero rates in years with high historical bankruptcy rates |
| Return delta test | Full-history run minus current-constituents-only run | Any positive delta indicates survivorship inflation |
When the survival curve stays flat through 2000–2002 or 2008–2009, that is not resilience. It means your dataset did not record the failures. A return delta greater than a few percentage points annually is a strong signal that delisted assets are carrying meaningful weight. At that point, stop refining the strategy and fix the data first.
Step-by-step: how to remove survivorship bias from your backtests
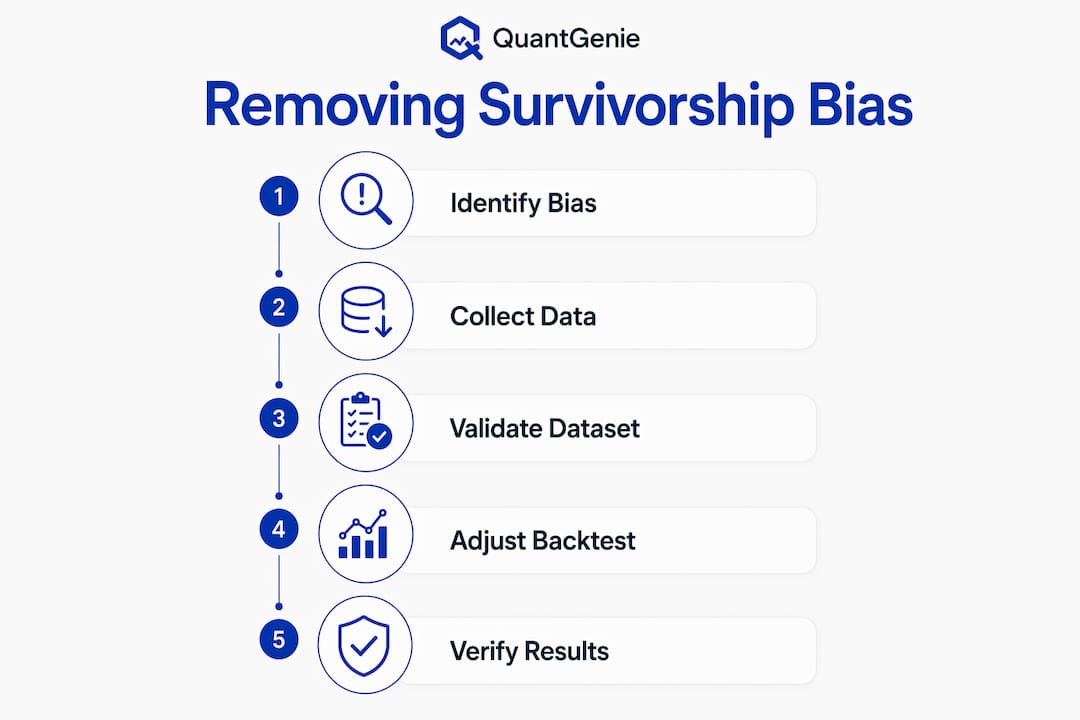
- Obtain point-in-time constituent lists. Source historical membership snapshots with explicit entry and exit timestamps. Point-in-time databases that include delisting records are the foundation; everything else builds on them.
- Backfill delisted asset prices. For each delisted name, use the last available trade price, a liquidation proxy (e.g., 10–20% of par for bankruptcies), or a conservative assumption documented in your audit trail. Never silently drop the asset.
- Apply corporate-action adjustments point-in-time. Use the adjustment factors that were known at the time of each historical date, not today’s retroactively corrected logs.
- Rerun with original-universe snapshots. Replace your current-constituents universe with the reconstructed historical universe at each rebalance date and compare results against your original run.
- Add robustness tests. Walk-forward analysis, Monte Carlo resampling across delisting-rate scenarios, and stress tests that artificially increase delisting rates by 2x–3x all help separate genuine signal from selection artifacts.
Pro Tip: Deterministic algorithm generation is a practical guardrail during iterative refinement. If each strategy tweak produces an identical output given the same historical inputs, you can audit exactly what changed and why. Platforms like Quantgenie enforce this by design, preventing the incremental, undocumented parameter cuts that quietly remove failures from the sample.
What should you demand from a data vendor?
Treat this as a procurement checklist. A vendor that cannot supply these fields is selling you survivorship-pruned data:
- Historical constituent snapshots with explicit
membership_startandmembership_endtimestamps delisting_dateanddelisting_reasonfor every removed asset- Split, merger, and dividend adjustment logs tied to announcement dates, not effective dates
- Trade-level fill records for delisting events (last trade price, suspension date)
- Versioned, immutable data snapshots so a backtest run today matches one run six months ago
Ask for point-in-time replay support and a published change log for index maintenance events. Before signing any contract, request a raw sample covering at least one full market cycle (2007–2009 qualifies) and verify that delisting counts match publicly available bankruptcy and merger records for that period.
Common mistakes when correcting for survivorship bias
Fixing the bias incorrectly can introduce new problems that are harder to detect:
- Lookahead bias from constituent reconstruction. Adding a stock to your historical universe based on when you know it was added, rather than when that information was publicly available, is lookahead bias. Use announcement dates, not effective dates.
- Optimistic liquidation price assumptions. Assuming a delisted stock exits at its last reported price ignores the illiquidity discount common in distressed situations. Use conservative proxies.
- Incorrect corporate-action handling. Applying today’s split-adjusted prices to a pre-split historical period distorts entry and exit calculations.
- Insufficient sample size after filtering. Strict survivorship-free filtering can shrink your universe significantly. A universe too small to support statistical inference is a different problem, not a solution.
Survivorship bias, lookahead bias, and selection bias are related but distinct. Survivorship bias removes failed assets retroactively. Lookahead bias uses future information at a past decision point. Selection bias is the broader category: any non-random exclusion that distorts the sample. All three can coexist in the same dataset.
A worked numerical example: the cost of excluding delisted stocks
Consider an equal-weighted backtest over a 10-year period with a starting universe of 500 stocks, rebalanced quarterly. Assume 8% of the universe delists each year, with delisted stocks averaging a 60% loss at exit.
Survivorship-pruned run: Only the 220 stocks still trading at period end are included. Cumulative return: 142%. Max drawdown: 18%. Annualized volatility: 11%. Sharpe ratio: 1.4.
Survivorship-free run: All 500 original stocks are included, with delisted names exiting at the conservative liquidation price. Cumulative return: 94%. Max drawdown: 31%. Annualized volatility: 16%. Sharpe ratio: 0.8.
The pruned run overstates cumulative return by 48 percentage points, understates max drawdown by 13 points, and nearly doubles the Sharpe ratio. Two visualizations make this concrete: a survival curve showing the universe shrinking from 500 to 220 over time, and overlaid equity curves where the pruned run diverges upward most sharply during the years with the highest delisting rates.
Your pre-deployment backtest checklist
- Verify point-in-time constituents and delisting records. Without these, every other metric is built on a flawed foundation.
- Run the survival curve and universe-size diagnostics. A flat count during market stress periods means data is missing, not that your strategy avoided losses.
- Test delisting price handling. Compare results under optimistic, conservative, and liquidation-proxy assumptions to bound the uncertainty.
- Perform walk-forward and Monte Carlo robustness tests. These separate genuine signal from patterns that only exist in the survivorship-pruned sample.
- Demand and verify a vendor data sample. Confirm delisting counts against public records for at least one full market cycle before trusting the feed.
Minimum acceptable evidence to proceed to paper trading: point-in-time constituents confirmed, delisting records present for at least 95% of exits, return delta between full-history and pruned runs documented, and at least one walk-forward pass completed.
Key Takeaways
Survivorship bias inflates backtest returns, compresses risk metrics, and produces strategies overfit to a past that never existed, making point-in-time data and delisting records the single most important fix.
| Point | Details |
|---|---|
| Bias enters at the data level | Datasets limited to current constituents silently exclude failed assets, inflating every performance metric. |
| Risk metrics are hit hardest | Excluding delisted stocks understates max drawdown and volatility while inflating Sharpe and Sortino ratios. |
| Detection is fast | A universe-size-over-time plot and a return delta test between full-history and pruned runs reveal the problem in minutes. |
| Mitigation requires point-in-time data | Correct backtests need constituent snapshots with membership_start/membership_end and explicit delisting_date fields. |
| Quantgenie enforces deterministic testing | Quantgenie’s deterministic algorithm generation and institutional-grade data support reproducible, survivorship-free backtests. |
The bias practitioners keep underestimating
Most teams I see treat survivorship bias as a data-cleaning task they will get to eventually. They run the backtest first, get excited about the numbers, and then rationalize why the data is probably fine. That ordering is the real problem.
The organizational fix is simple but rarely implemented: make point-in-time validation a gate, not a footnote. Require a documented audit trail for backtest inputs before any strategy reaches paper trading. If the delisting records are not present and verified, the backtest does not advance. That policy takes an afternoon to write and prevents months of chasing a phantom edge. The cognitive pull toward success stories is strong enough that without a hard gate, teams will always find a reason the data is good enough.
Quantgenie gives you survivorship-free backtests without the data headaches
Most traders know they need point-in-time data. The gap is in getting it, verifying it, and keeping it consistent across every strategy iteration. Quantgenie closes that gap directly: the platform provides institutional-grade historical data with constituent snapshots, delisting records, and deterministic algorithm generation that produces identical results on identical inputs every time.
That last part matters more than it sounds. When you refine a strategy across ten iterations, deterministic generation means you can audit exactly what changed and why, with no undocumented parameter drift that quietly removes failures from the sample. The built-in diagnostics, including survival curves and universe-size metrics, run automatically so you see the red flags before they become expensive live-trading mistakes. For traders who want to validate their quantitative ideas before committing capital, Quantgenie offers a trial that includes a sample historical-constituents export. Start there, run the return delta test against your current dataset, and see the gap for yourself.
Useful sources and further reading
- Survivorship Bias (Wikipedia) — The most complete reference for the statistical definition, the S&P 500 constituent example, and the Abraham Wald bomber case. Start here for the foundational framing.
- Survivorship Bias (MasterClass) — Accessible applied summary covering the Wald example and business use cases; useful for explaining the concept to non-quant stakeholders.
- The Perils of Survivorship Bias (Scientific American) — Behavioral science perspective from Sendhil Mullainathan and Katy Milkman on why success stories dominate samples; supports the cognitive-bias angle.
- Survivorship Bias (StatisticsByJim) — Practitioner-focused explanation of point-in-time databases and delisting record requirements; directly useful for vendor-negotiation conversations.
- Survivorship Bias (Scribbr) — Clear treatment of how missing failures hide noisy attributes and produce false causal inferences; good reference for the overfitting argument.
- Survivorship Bias (The Decision Lab) — Behavioral framing with cross-industry examples; useful for understanding why the bias persists organizationally even when practitioners know about it.