
Data Snooping Bias Explained: Avoid Overfitting in Models

Data snooping bias happens when you test, tweak, or select hypotheses on the same dataset you used to discover them, making results look significant when they are really just noise. The single most important defense: lock away a holdout set before you touch your data, and never let it influence model development.
Three things you can do right now:
- Split your dataset into a discovery set and a sealed confirmation set before any analysis begins.
- Write down your hypothesis and model rules before looking at results, not after.
- Count every test you run, not just the ones you report, when assessing statistical significance.
Key Takeaways
Data snooping bias invalidates statistical inference whenever hypotheses are chosen after inspecting the data, and the only reliable defense is separating discovery from confirmation before analysis begins.
| Point | Details |
|---|---|
| Separate discovery from confirmation | Lock away a holdout set before any analysis; use it exactly once as a final confirmation test. |
| Count every comparison | Apply Bonferroni or Benjamini–Hochberg FDR based on the total number of tests run, not just those reported. |
| Out-of-sample results are the only ones that matter | In-sample or training-set performance is unreliable for live trading; walk-forward and holdout results are the standard. |
| Use White’s Reality Check for large strategy searches | When many strategies are tested on the same dataset, White’s Reality Check or SPA corrects for model-selection bias. |
| Quantgenie enforces deterministic, reproducible backtests | Quantgenie’s platform uses validated historical data and deterministic builds to prevent inadvertent snooping during strategy development. |
Table of Contents
- What data snooping bias actually means (and how it differs from related terms)
- How data snooping creeps into real workflows
- Why repeated testing breaks statistical inference
- How snooping specifically harms algorithmic trading and backtesting
- Practical steps to prevent data snooping in research and trading
- Diagnostic tests that reveal whether a signal is real
- A practitioner checklist before you trust a model for live trading
- How data snooping damages scientific reproducibility and decision-making
- Reporting standards and transparency practices that reduce snooping risk
- Common misconceptions about data snooping bias
- Tools and software that help detect and prevent data snooping
- The operational risk most practitioners underestimate
- Quantgenie builds the controls that prevent snooping into the platform itself
- Sources
What data snooping bias actually means (and how it differs from related terms)
The terms get used interchangeably, but they describe slightly different behaviors. Here is a quick map:
| Term | What it describes | Where you see it most |
|---|---|---|
| Data snooping bias | Using the same data for discovery and inference, so results are not independent | Research, backtesting, ML model selection |
| Data dredging | Running many tests and reporting only the significant ones | Academic studies, A/B testing |
| P-hacking | Manipulating analysis choices until p < 0.05 | Psychology, nutrition research |
| HARKing | Hypothesizing After Results are Known; presenting post-hoc findings as pre-planned | Journal submissions |
| Multiple comparisons problem | Type I error inflation when many simultaneous tests are run | Any multi-variable study |
| Overfitting | Model fits training data noise rather than real signal | Machine learning, trading algorithms |
| Look-ahead bias | Using information in a backtest that would not have been available at trade time | Algorithmic trading |
Stanford Data Science’s explanation of data snooping uses a jelly bean example that captures the core problem cleanly: if you test 20 colors for a link to acne and one comes back significant at p < 0.05, you have a 64% chance of finding at least one false positive by chance alone. The result is not a discovery. It is a lottery win.
The statistical machinery behind this is the multiple comparisons problem. Every additional test you run on the same data raises the probability that at least one result crosses the significance threshold by chance. Two standard corrections exist. Bonferroni divides the target alpha by the number of tests (strict, conservative, good when tests are independent). Benjamini–Hochberg FDR controls the expected proportion of false discoveries among all rejected hypotheses (less conservative, preferred when tests are correlated). Both require you to know how many comparisons you actually made, which is the hard part when analysis is exploratory.
How data snooping creeps into real workflows
Most snooping is not deliberate. It accumulates through small, individually reasonable-seeming decisions that collectively corrupt inference.
Common patterns that create snooping risk:
- Parameter sweeps without holdouts. You test 50 moving-average combinations, pick the one with the best Sharpe ratio, and report it. Every rejected combination contributed to the selection, but none of that search is reflected in your significance estimate.
- Subgroup fishing. A treatment shows no effect overall, so you slice by age, gender, and region until one subgroup looks significant. That subgroup was selected because it was significant, not because theory predicted it.
- Optional stopping. You peek at accumulating data and stop the experiment when results cross p < 0.05. This inflates Type I error substantially even with just a few interim looks.
- HARKing. You run an exploratory study, find an unexpected pattern, then write the paper as though that pattern was the original hypothesis. Reviewers see a clean confirmatory study; the reality was exploratory.
- Changing the outcome measure. After seeing the data, you switch from the primary endpoint to a secondary one that looks better.
In a backtesting context, the failure mode is especially concrete. Imagine you are testing a momentum strategy on several years of S&P 500 data. You try many parameter combinations, find one that looks highly profitable with strong Sharpe ratio, and call it your strategy. What you have actually done is fit a curve to five years of noise. The Elder Research analysis of data mining mistakes puts it plainly: only out-of-sample results matter. Training results tell you almost nothing about live performance when the model was selected from a large search.
Why repeated testing breaks statistical inference
The logic of a p-value rests on a single assumption: the hypothesis was specified before the data were seen. When that assumption breaks, the p-value loses its meaning entirely.
Sage Research Methods describes the mechanism directly: performing many hypothesis tests on the same dataset increases the actual significance level well above the nominal alpha, and findings from repeated searches often fail to replicate. If you run 20 independent tests at a 0.05 significance level, there is a high chance of at least one false positive. As the number of tests increases, this chance grows even higher.
The reproducibility crisis in psychology, nutrition science, and biomedical research is partly a snooping problem at scale. Studies that reported clean, significant results failed to replicate when independent labs ran pre-registered versions of the same experiments. The culprit was rarely fraud. It was the accumulation of small analytic choices, each defensible in isolation, that collectively inflated the false-positive rate.
Two structural fixes have gained traction in academic publishing. Pre-registration requires researchers to file their hypotheses, sample size, and analysis plan with a registry (OSF, AsPredicted, ClinicalTrials.gov) before data collection. Registered Reports go further: journals peer-review the study design and commit to publish regardless of the result, removing the incentive to p-hack toward significance. Neither fix is perfect, but both force the researcher to commit before seeing the data, which is the only reliable way to preserve the meaning of a p-value.
How snooping specifically harms algorithmic trading and backtesting
In trading, data snooping bias has a direct financial cost. A strategy that looks excellent in backtest but fails live is not just an academic problem. It is capital at risk.
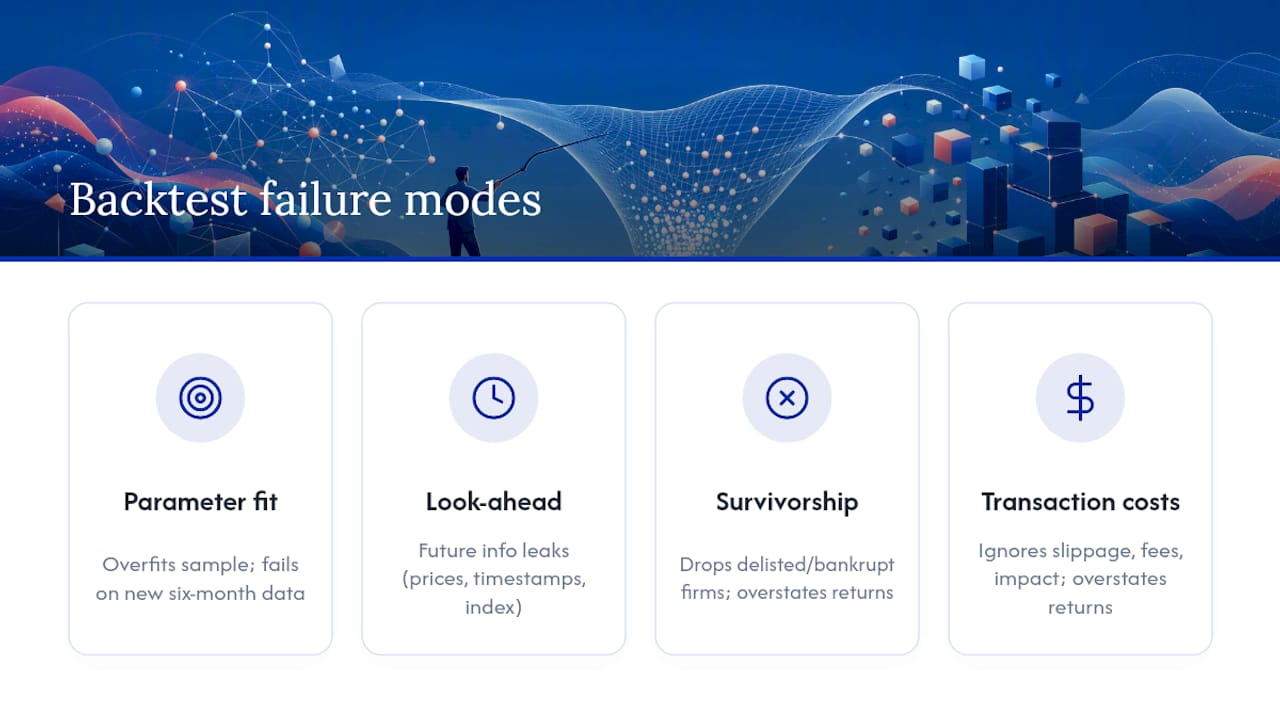
The classic failure modes break down into four categories:
Parameter curve-fitting. You optimize entry/exit thresholds, lookback windows, and position sizing rules on historical data. The resulting parameter set is exquisitely tuned to the idiosyncrasies of that specific sample period. Change the sample by six months and performance collapses.
Look-ahead bias. Information that would not have been available at trade time leaks into the backtest. Common sources include adjusted closing prices applied retroactively, earnings announcements recorded at the wrong timestamp, and index membership data that reflects current composition rather than historical composition. Elder Research’s documentation of backtest artifacts specifically flags accepting leaks from the future as one of the most frequent and damaging mistakes in applied modeling.
Survivorship bias. Your backtest universe contains only stocks that still exist today. Companies that went bankrupt or were delisted during the test period are absent, which systematically overstates returns.
Transaction cost omission. Strategies that trade frequently look far better when slippage, commissions, and market impact are excluded. Gross returns can be dramatically reduced once realistic costs are applied.
Pro Tip: Before trusting any backtest result, ask: “What would this strategy have returned on a dataset I never touched during development?” If you cannot answer that question with a clean holdout period, the result is not a result. It is a hypothesis.
Practical steps to prevent data snooping in research and trading
Prevention is mostly a discipline problem, not a technical one. The tools exist. The hard part is using them before you see the data.
- Write your hypothesis before you look. State the specific model, parameters, and success criteria in a document with a timestamp. This is the minimum viable version of pre-registration.
- Split your data immediately. Reserve a portion of your data as a sealed holdout set. Do not touch it until you have finalized your model. Treat it as a one-shot confirmation test.
- Count all comparisons. Keep a log of every model variant, parameter combination, and subgroup you test. Apply Bonferroni or Benjamini–Hochberg FDR correction to your reported results based on the full count, not just the tests you report.
- Use cross-validation for model selection. K-fold or time-series cross-validation gives a less biased estimate of generalization performance than in-sample metrics. For time-series data, always use forward-chaining splits that respect temporal order.
- Apply walk-forward analysis for trading strategies. Divide the historical period into rolling windows. Train on each window, test on the next, and aggregate results. This simulates how the strategy would have performed if deployed incrementally.
- Model realistic transaction costs. Include bid-ask spread, commission, and slippage estimates calibrated to the strategy’s actual trade frequency and position size.
- Test across multiple market regimes. A strategy that works in a trending bull market may fail in a range-bound or high-volatility environment. Segment your test period by regime and check whether performance holds.
- Apply Benjamini–Hochberg FDR when running many correlated tests. Bonferroni is appropriate when tests are independent and you need strict family-wise error control. FDR control is more powerful when tests are correlated (as they often are in financial factor research) and you can tolerate a small proportion of false discoveries.
- Use data provenance and model governance tools to track which data touched which model version. Audit trails prevent inadvertent reuse of confirmation data during iteration.
- Pre-register exploratory studies when possible. Even a simple timestamped document filed before analysis begins provides meaningful protection against post-hoc rationalization.
Diagnostic tests that reveal whether a signal is real
Knowing a signal might be spurious is one thing. Having a test that quantifies how likely it is to be spurious is more useful.
| Diagnostic method | What it tests | When to use it |
|---|---|---|
| Permutation test | Whether the observed effect exceeds what random label shuffling produces | Any supervised model; tests if the target variable drives the result |
| Bootstrap stability | Whether the effect size and direction are stable across resampled versions of the data | Checking robustness of a coefficient or metric before reporting |
| Out-of-sample stability check | Whether in-sample performance holds on a held-out time slice | Final validation before live deployment |
| Walk-forward analysis | Whether strategy performance is consistent across rolling train/test windows | Trading strategies with time-series data |
| White’s Reality Check | Whether the best model in a search is genuinely better than a benchmark after adjusting for model selection | When many strategies have been tested on the same dataset |
| SPA (Superior Predictive Ability) | A refinement of White’s Reality Check with better power against poor models | Large-scale strategy comparison in quantitative finance |
Permutation testing works by randomly shuffling the outcome labels (or returns) many times and measuring how often the shuffled data produces a result as good as the real one.
White’s Reality Check, formalized in White (2000), addresses a specific problem in quantitative finance: when you test many trading rules on the same historical data, the best-performing rule is almost certainly overfit. White’s procedure uses a bootstrap to construct a null distribution for the best model’s performance, accounting for the fact that many models were tried. The SPA test refines this by removing poorly performing models from the null, which increases statistical power.
Out-of-sample stability checks are the most practical diagnostic for most traders. Split your historical data into three parts: training, validation (used for parameter selection), and a final test set that was never used for any decision. If performance on the test set is materially worse than on the validation set, the model is overfit.
A practitioner checklist before you trust a model for live trading
This checklist applies to both researchers finalizing a study and traders preparing to deploy a strategy. Work through it in order.
- Pre-specify everything. Document your model structure, entry/exit rules, and performance thresholds before running any backtest on the full dataset.
- Seal your holdout set. Partition the data before analysis. The holdout is used exactly once, at the end, as a final confirmation test.
- Log every model variant you test. The log feeds your multiple-testing correction. If you tested 40 parameter sets, your effective alpha is not 0.05.
- Run cross-time validation. For trading strategies, use walk-forward analysis across at least three non-overlapping periods. Check that performance is directionally consistent across all windows.
- Test across market regimes. Include at least one trending period, one mean-reverting period, and one high-volatility period in your validation set.
- Check parameter robustness. Perturb your optimal parameters by ±10–20% and verify that performance degrades gradually rather than collapsing. Sharp cliffs indicate curve-fitting.
- Apply White’s Reality Check or SPA if you tested more than 10–15 strategy variants on the same dataset.
- Model full transaction costs. Use realistic bid-ask spreads and commission estimates. For high-frequency strategies, include market impact.
- Run a paper-trade period. Before committing capital, run the strategy in a simulated live environment for at least 30–60 trading days. Monitor whether live signals match backtest signals exactly.
- Set a p-value drift alert. Track whether the strategy’s performance metrics are degrading over time in live trading. A sustained drawdown that was not present in any validation window is a signal to pause and re-evaluate.
Pro Tip: Prefer platforms that enforce deterministic builds, meaning the same strategy inputs always produce the same backtest output. Non-deterministic backtests make it impossible to isolate whether a change in results came from a model change or a data change, which is itself a form of inadvertent snooping.
How data snooping damages scientific reproducibility and decision-making
The reproducibility problem in science is not a recent discovery, but its scale became undeniable when large-scale replication projects found that a substantial proportion of published findings in psychology and related fields failed to replicate under pre-registered conditions. Data snooping is one of the primary structural causes.
The mechanism is straightforward. When researchers have flexibility in how they analyze data, they tend, often unconsciously, to make choices that move results toward significance. Each choice is defensible. The combination is not. This is sometimes called the “garden of forking paths”: the final analysis looks like one pre-planned test, but it was actually selected from dozens of possible paths through the data.
The downstream consequences extend beyond academia. Clinical treatment guidelines, public health policy, and financial risk models have all been built on findings that later failed to replicate. The UT Austin statistics mistakes resource frames this clearly: data snooping is post-hoc inference, and the remedy is to plan analyses, account for hidden comparisons, and separate discovery data from confirmation data. When that discipline is absent, the published literature accumulates false positives that take years to correct.
For decision-makers outside academia, the practical implication is to treat any single study, especially one that was not pre-registered, as a hypothesis rather than a conclusion. Replication, ideally by an independent team on a new dataset, is the only reliable confirmation.
Reporting standards and transparency practices that reduce snooping risk
Several concrete reporting norms have emerged to make snooping harder to hide and easier to detect.
CONSORT and STROBE checklists require clinical and observational studies to report their primary outcome, sample size calculation, and analysis plan. Deviations from the pre-specified plan must be declared. This does not prevent snooping, but it makes it visible.
The EQUATOR Network maintains a library of reporting guidelines across study types. Following the relevant guideline for your study design forces disclosure of analytic decisions that would otherwise remain hidden.
Registered Reports, now offered by over 300 journals, commit the journal to publish the study based on the quality of the design, not the significance of the results. This removes the publication bias that rewards positive findings and penalizes null results.
Open data and open materials policies require researchers to share their raw data and analysis code. When another researcher can re-run your analysis, the full set of decisions you made becomes auditable. Selective reporting becomes much harder to sustain.
For quantitative traders and model builders, the equivalent practices are audit logs, version-controlled strategy code, and reproducible backtest reports. A backtest that cannot be reproduced exactly, given the same inputs, is not a reliable basis for deployment.
Common misconceptions about data snooping bias
“I only ran a few tests, so it’s fine.” The number of tests matters less than whether the hypothesis was specified before the data were seen. Even a single test is compromised if the hypothesis was chosen because the data suggested it.
“More data solves the problem.” Adding more data to the same dataset does not cure snooping if the same data was used for discovery and confirmation. Separation of discovery and confirmatory data is what matters, not volume alone.
“My model is complex, so overfitting is expected and acceptable.” Overfitting is a symptom of snooping, not a feature. A model that fits noise rather than signal will underperform in live use regardless of its complexity.
“Out-of-sample testing is too conservative.” Some researchers argue that holding out data wastes information. This is true in small samples, but the cost of a false positive, especially in trading or clinical research, almost always exceeds the cost of a slightly less precise estimate.
“P-hacking only happens in bad research.” P-hacking is largely unconscious. Researchers who genuinely believe they are running a single confirmatory test are often running what is effectively an exploratory search, because they made analytic decisions after seeing the data. The problem is structural, not a matter of intent.
“A significant result on a large dataset must be real.” Large samples increase statistical power, which means even trivially small effects become significant. A p-value of 0.001 on a million-row dataset may reflect an effect size too small to matter practically. Always report effect sizes alongside p-values.
Tools and software that help detect and prevent data snooping
Several categories of tools address different parts of the snooping problem.
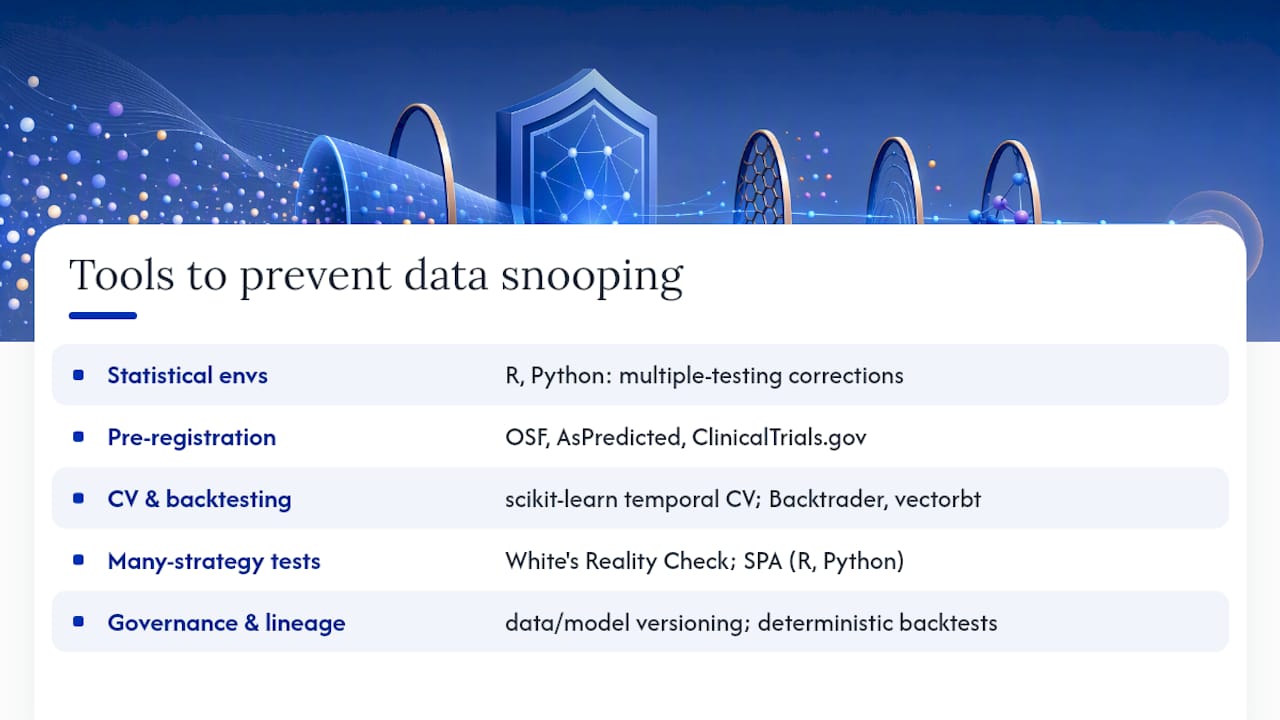
Statistical computing environments. R and Python are the primary environments for implementing multiple-testing corrections. In R, the p.adjust() function applies Bonferroni, Benjamini–Hochberg, and several other corrections with a single call. Python’s statsmodels library includes multipletests() for the same purpose. Both are free and well-documented.
Pre-registration platforms. The Open Science Framework (OSF) and AsPredicted.org allow researchers to file timestamped, publicly visible study plans before data collection. ClinicalTrials.gov serves the same function for clinical research. These are free to use and increasingly required by journals.
Cross-validation and backtesting frameworks. For machine learning, scikit-learn’s TimeSeriesSplit enforces temporal ordering in cross-validation, preventing future data from leaking into training folds. For trading, walk-forward analysis frameworks in Python (Backtrader, vectorbt) support rolling train/test splits with configurable window sizes.
White’s Reality Check and SPA implementations. Academic implementations of these tests exist in R (the MCS package for model confidence sets) and in standalone Python scripts. They are computationally intensive but appropriate when many strategies have been compared on the same dataset.
Model governance and data lineage tools. Platforms that track which data version was used to train which model version prevent inadvertent reuse of confirmation data. Data quality and model governance tooling addresses this at the pipeline level, logging data provenance and model versioning in a way that makes snooping-related reuse auditable.
Deterministic backtesting platforms. For traders, the most practical defense is a platform that enforces reproducible, deterministic outputs. When the same strategy inputs always produce the same backtest results, you can isolate the effect of any change and prevent the kind of iterative tweaking that accumulates snooping risk invisibly.
The operational risk most practitioners underestimate
The framing I find most useful is this: data snooping is not a statistical technicality. It is a production risk. A strategy or model that passed every in-sample test but was never validated on genuinely held-out data is a liability dressed as an asset. The failure mode is not “slightly worse performance.” It is a strategy that looked like it had edge and had none.
The culture shift required is harder than the technical fix. Researchers and traders are rewarded for finding signals, not for correctly concluding that no signal exists. Pre-registration, holdout discipline, and multiple-testing corrections all make it harder to produce a positive result, which creates friction in environments that reward positive results. The organizations that take reproducibility seriously, running registered reports, enforcing audit logs, and requiring out-of-sample confirmation before deployment, are the ones building models that actually work in production. The technical tools are available to everyone. The discipline to use them before you see the data is what separates reliable inference from expensive noise.
Quantgenie builds the controls that prevent snooping into the platform itself
Most snooping prevention relies on individual discipline. Quantgenie makes it structural. The platform generates trading algorithms deterministically from plain-language strategy descriptions, meaning the same inputs always produce the same backtest output. There is no room for the iterative tweaking that accumulates snooping risk invisibly. Backtests run on institutional-grade validated historical data, with audit logs that record exactly which data and which strategy version produced each result.
For traders who want walk-forward testing, realistic transaction cost modeling, and reproducible performance reports without writing a line of code, Quantgenie’s platform enforces the holdout and validation discipline that the checklist above describes. The architecture is designed so that the confirmation test stays sealed until you choose to run it. Build your first strategy on Quantgenie and see what a deterministic, snooping-resistant backtest actually looks like before you commit capital.
This article is general information, not a substitute for advice from a qualified financial advisor. Consult a qualified financial professional about your own circumstances before acting on anything here.
Sources
- Top 10 Data Mining Mistakes
- Data Snooping
- A REALITY CHECK FOR DATA SNOOPING …
- Data snooping - Stanford Data Science