
Walk Forward Analysis: A Practitioner’s Guide for Traders

Walk forward analysis (WFA) is a strategy validation method that repeatedly optimizes parameters on a historical in-sample window, then tests those parameters on a subsequent out-of-sample window it has never seen before, rolling the process forward until the full dataset is consumed. A strategy that holds up across multiple independent out-of-sample periods has demonstrated something a single backtest never can: that its edge is not a product of curve-fitting to one slice of history. Robert E. Pardo formalized this approach in his 1992 book, and it has since become the professional standard for walk forward optimization. Platforms like Interactive Brokers (IBKR) reference it as the benchmark for realistic backtesting, and tools like Build Alpha are built around it.
Table of Contents
- Why walk forward analysis exists and where it fits
- How walk forward analysis works: IS windows, OOS windows, and stepping logic
- Choosing the right WFA settings
- What is the walk-forward matrix and how do you read it?
- Advantages, pitfalls, and where WFA falls short
- Step-by-step implementation and a short worked example
- Practitioner checklist for valid forward testing
- When should you actually use walk forward analysis?
- Key Takeaways
- Why most traders underestimate the discipline side of WFA
- Quantgenie makes WFA workflows reproducible and code-free
- Useful sources and further reading
Why walk forward analysis exists and where it fits
A single backtest is a closed loop. You optimize parameters on data, then measure performance on the same data, and the result is almost always flattering. WFA breaks that loop by enforcing a strict separation between the data used to find parameters and the data used to judge them.
Pardo’s contribution was not just the idea but the discipline: treat historical data as a dynamic environment, not a static archive. His framework pushed practitioners to ask whether a strategy’s parameters would have survived if they had been chosen before each new period began, not after the whole period was known.
WFA fits into a professional validation sequence that looks like this:
- Build: Define rules, logic, and cost model before touching data.
- Backtest: Run a single full-history test to confirm the edge exists and is not obviously broken.
- Walk forward: Validate parameter stability and out-of-sample consistency across multiple independent windows.
- Monte Carlo / bootstrap: Stress-test the combined OOS equity curve for ruin probability.
- Forward demo (30–90 days, real tick stream): Confirm execution fidelity and rule adherence before any capital is at risk.
- Micro live: Trade minimum size to measure live slippage and latency.
- Scale: Increase size only after micro-live confirms the model.
Skipping the forward-demo step or running it on synthetic feeds is one of the most common operational failures practitioners encounter. Common use cases for WFA specifically include parameter stability checks across market regimes, regime-sensitivity analysis for trend-following or mean-reversion strategies, and setting realistic retraining cadences for machine learning models.
How walk forward analysis works: IS windows, OOS windows, and stepping logic
Every WFA run is built from the same three components: an in-sample (IS) window where optimization happens, an out-of-sample (OOS) window where the best parameters are tested on unseen data, and a step (or stride) that moves both windows forward in time.
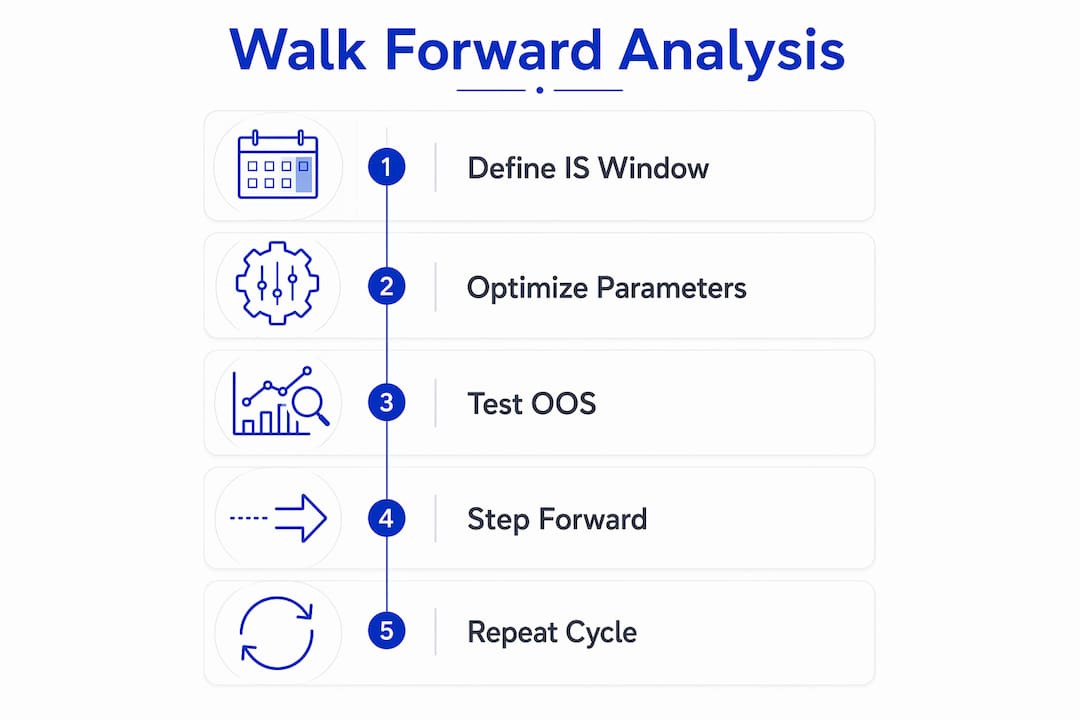
A single walk-forward cycle
Start with, say, three years of daily data. You designate the first two years as IS and the final four months as OOS. You run your optimizer on the IS window, select the best parameter set by your chosen objective (Sharpe, expectancy, net P&L after costs), then apply those exact parameters to the OOS window without touching them. Record the OOS equity curve and all metrics. That is one cycle.
Now step forward: shift both windows by the step size (say, one month), so the IS window covers months 2–25 and the OOS window covers months 26–29. Repeat. After enough cycles, you concatenate every OOS equity curve into a single combined OOS equity curve. That combined curve is the real test of your strategy.

Anchored vs rolling WFA
The two main variants differ in how the IS window grows over time.
Rolling (sliding) WFA keeps the IS window at a fixed length. As you step forward, the oldest data drops off the back end. This is better for strategies that need to stay sensitive to recent regimes, because stale data from a very different market environment does not dilute the optimization.

Anchored (expanding) WFA keeps the start date fixed and grows the IS window with each step. You accumulate more data over time, which can stabilize parameter estimates for low-frequency strategies with sparse trade counts. The tradeoff: early market regimes carry increasing weight as the window grows, which can be a problem if the strategy’s edge is regime-dependent.
For most systematic equity or futures strategies, rolling WFA is the default. Anchored WFA makes more sense when you have a long-horizon macro model where regime persistence matters and you want the optimizer to see as much history as possible.
Choosing the right WFA settings
There is no universal formula, but there are sensible starting points. A typical starting point for the IS/OOS split is allocating 70% of data to in-sample and 30% to out-of-sample, as this balances parameter stability and test meaningfulness. For high-frequency strategies with hundreds of trades per month, you can compress the OOS window because statistical power accumulates faster. For low-frequency strategies trading a handful of times per month, you need a longer OOS window to get enough trades for any metric to be meaningful.
Key rules of thumb:
- Out-of-sample windows should be long enough to capture a sufficient number of trades to yield reliable metrics before placing trust in performance indicators from those windows.
- IS windows should be long enough to cover at least two full market cycles (bull + bear, or expansion + contraction) for the strategy’s timeframe.
- Step size should equal the OOS window length for non-overlapping, independent OOS periods. Overlapping steps inflate the apparent number of OOS observations without adding independence.
- Ensure in-sample windows are of adequate length for the strategy’s timeframe to avoid the optimizer fitting noise instead of meaningful patterns.
Optimization objective choices matter more than most traders realize. Optimizing on raw net P&L rewards strategies that take large positions in favorable periods, which often means high drawdown. Sharpe ratio or Sortino ratio penalizes that behavior. Expectancy after realistic transaction costs (commissions, slippage, spread) is arguably the most honest objective because it forces the cost model into the optimization loop from the start.
| Setting | Short IS window | Long IS window |
|---|---|---|
| Parameter stability | Lower; overfits recent regime | Higher; averages across regimes |
| Regime sensitivity | Higher; adapts quickly | Lower; slow to adapt |
| Trade count per IS | Fewer; noisy optimization | More; stable estimates |
| Best for | High-frequency, mean-reversion | Low-frequency, trend-following |
| Setting | Small OOS window | Large OOS window |
|---|---|---|
| Trade count | Fewer; metrics unreliable | More; metrics meaningful |
| Regime coverage | Narrow | Broader |
| Number of WFA cycles | More cycles possible | Fewer cycles |
| Best for | High-frequency strategies | Low-frequency strategies |
What is the walk-forward matrix and how do you read it?
The walk-forward matrix is a structured summary of every OOS window’s performance, arranged so you can scan for consistency across time. Each row represents one OOS period; each column reports a metric for that period. The combined OOS equity curve is what you get when you chain all those OOS periods end-to-end.
Metrics to record per OOS window:
- CAGR (annualized return for the OOS period)
- Sharpe ratio
- Maximum drawdown
- Expectancy per trade
- Trade count
- Win rate
- Average holding period / turnover
- Estimated execution slippage vs modeled slippage
A sample matrix structure looks like this:
| OOS Period | CAGR | Sharpe | Max Drawdown | Trade Count | Win Rate |
|---|---|---|---|---|---|
| Period 5 | — | — | — | — | 53% |
Note: these figures are illustrative examples for format reference only.
What you are looking for is not perfection in every row but consistency. A strategy that posts positive CAGR in four of five OOS windows, with no single window blowing up the drawdown, is a much stronger signal than one that averages well but has one catastrophic period hiding in the middle.
Simple statistical checks worth running: count the fraction of OOS windows with positive expectancy (a sign test against the null of 50/50), and run a bootstrap on the combined OOS equity curve to estimate a confidence interval around the Sharpe ratio. WFO with rolling IS windows is particularly useful for ML strategies because it validates whether the retraining cadence is realistic, not just whether the model fits.
Advantages, pitfalls, and where WFA falls short
What WFA reliably delivers:
- Reduced overfitting risk versus a single full-history backtest, because parameters are never chosen with knowledge of the OOS period.
- Regime-sensitivity detection: a strategy that collapses in two of five OOS windows is telling you something a single backtest would have buried.
- A realistic model of how a live strategy would behave if re-optimized on a rolling schedule.
Where it falls short:
- Window selection bias is real. A researcher who tries multiple IS/OOS ratios and picks the one that looks best has reintroduced data snooping through the back door.
- WFA does not protect against look-ahead bias or survivorship bias baked into the underlying data. Garbage data produces garbage OOS results, just with more ceremony.
- Computational cost scales with the number of parameters and the granularity of the grid. A strategy with ten parameters on a fine grid can take hours or days to run.
- If OOS windows contain too few trades, every metric is statistically meaningless regardless of how the matrix looks.
Operational failure modes that practitioners often overlook:
- OOS contamination: running the optimizer on data that includes the OOS period, even accidentally, invalidates the entire run.
- Rule drift: changing strategy logic mid-test because early OOS results look weak, then continuing as if the test is still valid.
- Frozen cost models: using a commission and slippage estimate from two years ago on a strategy you plan to trade today.
- Poor data hygiene: adjusted prices that shift after the fact, missing corporate actions, or survivorship-biased universes.
Pro Tip: Before running any WFA, assign a configuration hash to your code, data version, parameter grid, and cost model. Store it alongside the results. If you ever need to re-run, the hash tells you immediately whether anything changed. This is the simplest way to keep OOS runs genuinely virgin.
Step-by-step implementation and a short worked example
The workflow below applies whether you are coding in Python or using a platform. The logic is the same either way.
High-level workflow:
- Validate and version your data (check for gaps, splits, corporate actions, and timestamp alignment).
- Define your IS/OOS plan: window lengths, step size, number of cycles, and optimization objective.
- Lock your parameter grid and cost model before the first cycle runs.
- Loop: for each IS window, run the optimizer, save the best parameter set, apply it to the OOS window, record metrics.
- Concatenate OOS equity curves into the combined curve.
- Run the walk-forward matrix analysis and statistical checks.
- If the combined OOS curve passes your pre-defined acceptance criteria, proceed to forward demo.
Pseudocode:
for each step in walk_forward_schedule:
    IS_data = data[step.is_start : step.is_end]
    OOS_data = data[step.oos_start : step.oos_end]
    best_params = optimizer(IS_data, param_grid, objective=sharpe_after_costs)
    oos_results = apply_strategy(OOS_data, best_params)
    matrix.append(oos_results)

combined_oos_curve = concatenate(matrix.oos_equity_curves)
report(combined_oos_curve, matrix)
Short worked example: A 20/50 moving-average crossover on daily S&P 500 futures. IS window: 24 months. OOS window: 6 months. Step: 6 months. You optimize the fast and slow MA periods within a grid (fast: 10–30, slow: 40–80) using Sharpe after a $5 round-trip cost model. After five cycles, you have 30 months of combined OOS data. If the combined Sharpe is above 0.5 and at least four of five OOS windows are profitable, the strategy passes the first gate. If two or more windows show drawdowns exceeding your pre-defined 15% threshold, you reject it regardless of the average.
For tooling, Python users typically combine pandas, NumPy, and a backtesting library (Backtrader, Zipline, or VectorBT) with a custom WFA loop. Build Alpha is a dedicated platform built specifically around walk-forward optimization and is widely cited as an authoritative reference for practitioners who want a GUI-driven workflow. IBKR’s deep dive on walk forward analysis is worth reading as a conceptual grounding resource. For those working with ML models, QuantInsti’s tutorials cover how to align retraining cadence with OOS window design.
Practitioner checklist for valid forward testing
Running WFA correctly is partly a technical problem and partly a discipline problem. The technical part is solvable with good tooling. The discipline part requires deliberate process design, because the temptation to tweak after seeing weak OOS results is strong and almost always invalidates the test.
Pre-test lock list:
- Code version hash (commit ID or equivalent)
- Data version and source (date pulled, vendor, adjustment method)
- Parameter grid (fixed before any cycle runs)
- Cost model (commissions, slippage, spread, financing costs)
- Falsification criteria: specific thresholds for drawdown, expectancy drop, or win rate below which you will reject the strategy outright, not re-optimize
Execution discipline during forward demo:
- Log every trade signal generated, whether you took it or not.
- Tag each executed trade with its signal source and any deviation from the rule.
- Track execution metrics separately from outcome metrics: rule adherence rate, missed-trade rate, latency, and fill quality.
- Take a daily snapshot of the live equity curve against the expected OOS curve.
Post-test interpretation rules:
- Weak OOS (positive but below threshold): extend the forward demo, do not re-optimize.
- Failed OOS (hit a falsification threshold): treat as rejection. Re-conceptualize the strategy from scratch rather than adjusting parameters.
- Passed OOS: proceed to micro live with minimum size. A meaningful forward-demo period on real tick data is an essential step for any strategy intended for significant capital deployment.
Pro Tip: Write your falsification conditions into a one-page document before the test starts and sign it. The act of committing to rejection criteria in advance is the single most effective guard against post-hoc rationalization. Common automation pitfalls, including alert failures and logging gaps, can silently corrupt this process — a point worth reviewing in the context of AI automation mistakes that affect systematic workflows.
When should you actually use walk forward analysis?
WFA is not free. Each additional parameter doubles or triples compute time, and a thorough run on a complex strategy can take hours. The question is whether the validation value justifies the cost, and the answer depends on what you plan to do with the strategy.
Use WFA for any strategy you intend to trade with real capital. No exceptions for systematic strategies. A backtest alone is not sufficient evidence of edge; it is only evidence that the strategy could have worked in the past on the data you used to build it.
WFA is mandatory for:
- Medium and low-frequency strategies (daily, weekly bars) where parameter stability is the primary risk.
- ML-based models where retraining cadence is a design choice that needs validation.
- Any strategy that will be re-optimized on a schedule in live trading, because WFA is the only way to test whether that re-optimization process adds value or destroys it.
WFA is optional (but still useful) for:
- Exploratory research where you are screening many ideas and need a fast filter before committing to full validation.
- High-frequency strategies where the sheer volume of trades makes even a short OOS window statistically meaningful.
Operational thresholds to keep in mind: each OOS window needs at least 30 trades for metrics to carry weight, and the combined OOS curve should span at least 12 months of real calendar time before you draw strong conclusions. A clear transition rule set from demo to micro to full sizing, with explicit sample-count and expectation tolerances, reduces the risk of scaling into a strategy that only looked good in testing.
Key Takeaways
Walk forward analysis proves a strategy’s edge is real by validating parameters on multiple independent out-of-sample windows, making it the most reliable single test between a backtest and live trading.
| Point | Details |
|---|---|
| WFA vs single backtest | A single backtest proves fit to history; WFA proves parameters hold on unseen data across multiple periods. |
| IS/OOS split baseline | Start with a 70/30 IS/OOS split; each OOS window needs at least 30 trades to produce meaningful metrics. |
| Anchored vs rolling | Use rolling WFA for regime-sensitive strategies; use anchored WFA when maximizing historical sample size matters more. |
| Falsification first | Define drawdown and expectancy thresholds before the test starts; hitting them means rejection, not re-optimization. |
| Quantgenie for WFA | Quantgenie’s deterministic backtesting and reproducible configs support the full WFA workflow without writing code. |
Why most traders underestimate the discipline side of WFA
The mechanics of walk forward analysis are learnable in an afternoon. The part that actually separates profitable systematic traders from the rest is what happens after the first weak OOS window appears.
Every practitioner who has run WFA seriously has faced the same moment: three of five OOS windows look good, one looks mediocre, and one looks genuinely bad. The temptation is to examine that bad window, find a “reason” it underperformed (a news event, a regime shift, a data anomaly), and adjust the rules to handle it. That adjustment is the death of the test. You have just used OOS data to inform your parameter choices, which means it is no longer out-of-sample. The combined equity curve is now a lie.
The falsification framework is the antidote, and it works precisely because it removes the decision from the moment of temptation. If you wrote down before the test that two or more OOS windows with drawdown above 15% constitutes rejection, then the bad window is not an invitation to investigate. It is a result. The strategy failed. Move on.
This is also why the forward-demo phase matters beyond just execution testing. Thirty to ninety days of real-tick forward testing forces you to live with the strategy’s behavior in real time, without the ability to rewind. That psychological exposure is part of the validation. A strategy you cannot follow in real time without second-guessing every signal is not a strategy you can trade at scale, regardless of what the WFA matrix says.
The financial analysis techniques that matter most in systematic trading are not the exotic ones. They are the ones that enforce honesty about what you actually know versus what you have convinced yourself you know.
Quantgenie makes WFA workflows reproducible and code-free
Running a rigorous walk forward analysis requires locking configurations, managing data versions, and keeping OOS runs genuinely untouched. That operational overhead is where most individual traders and small teams lose discipline, not because they lack the intent but because the tooling makes it easy to accidentally contaminate a run.
Quantgenie handles the reproducibility layer for you. Strategies are defined in plain English and translated into deterministic algorithms, so every backtest and WFA run produces identical results under the same conditions. Institutional-grade market data, built-in performance metrics (Sharpe, drawdown, CAGR, expectancy), and a visual workflow mean you can run the full Build → Backtest → Walk-forward sequence without writing a line of Python. The platform’s AI-assisted result analysis lets you interrogate OOS windows directly, which is exactly the kind of structured review the practitioner checklist above calls for.
If you are ready to run a properly structured walk forward analysis on your next strategy, start on Quantgenie and see how far you get before you need to open a code editor.
Useful sources and further reading
- Walk Forward Optimization (Wikipedia) — Concise definition, historical note on Robert E. Pardo’s 1992 formalization, and a clear overview of the IS/OOS cycling mechanic.
- IBKR: The Future of Backtesting — A Deep Dive into Walk Forward Analysis — Interactive Brokers’ practitioner-level treatment of WFA, covering rolling windows, overfitting reduction, and live-trading simulation realism.
- QuantInsti: Walk-Forward Optimization — How It Works, Its Limitations, and Backtesting Implementation — Detailed tutorial covering WFO mechanics, ML retraining cadence, limitations (window bias, compute cost), and Python implementation guidance.
- Forex Mechanics: Backtesting and Forward Testing — Methodology and Pitfalls — Practical methodology guide covering the 70/30 split, rolling WFA, common errors (look-ahead bias, survivorship bias), and the professional demo-to-live transition framework.
- Kevin Goldberg / AIPredictiveSignals: Forward Testing AI Trading — Execution-focused forward-testing guide emphasizing process metrics (rule adherence, missed trades, latency) alongside outcome metrics.
- Build Alpha — A dedicated walk-forward optimization platform widely used by professional systematic traders; purpose-built for GUI-driven WFA without custom coding.
- CFA Institute: Financial Analysis Techniques — Foundational reference for the broader financial analysis framework within which WFA sits, covering sensitivity analysis, scenario analysis, and simulation techniques.