
No-Code Algorithmic Trading: Build and Deploy Without Programming

Yes, you can build and run algorithmic trading strategies without writing a single line of code. The practical path is shorter than most traders expect: pick a platform with a visual or natural-language builder, paper-trade a rules-based template for two to four weeks, then run a small live test with strict position limits.
Your three-step starting checklist:
- Choose a platform that supports your asset class and broker, offers deterministic backtesting, and provides institutional-quality historical data.
- Paper-trade a template strategy (a moving-average crossover or momentum breakout works well) for at least two weeks to validate execution behavior before risking capital.
- Run a limited live test with position sizes small enough that a complete loss is acceptable, then scale only after 30 days of consistent live performance.
Expect to spend a few hours building your first prototype, a few days running a solid backtest, and two to four weeks in paper trading before you have enough signal to go live. Platform subscriptions typically start at a moderate monthly cost, and the learning curve is real but manageable for anyone comfortable with spreadsheets and basic market concepts.
Key Takeaways
No-code algorithmic trading is practical for retail traders today: the build-test-deploy workflow is accessible without programming, but rigorous backtesting and paper trading remain non-negotiable before going live.
| Point | Details |
|---|---|
| Start with a clear hypothesis | Write your strategy as one sentence before opening any builder; vague ideas produce overfit backtests. |
| Reserve out-of-sample data | Split your historical data before optimizing; never test on data you used to build the strategy. |
| Model realistic costs | Include slippage and commission in every backtest; ignoring them inflates returns on high-frequency strategies. |
| Paper-trade before going live | Run several weeks of paper trading to catch execution surprises before risking capital. |
| Quantgenie for no-code builds | Quantgenie translates plain-English rules into deterministic algorithms with institutional-grade backtesting and broker integrations. |
Table of Contents
- What is no-code algorithmic trading and how does it work?
- How to build a no-code trading strategy from idea to paper test
- Backtesting best practices and the metrics that actually matter
- How to go live: broker integrations, execution, and monitoring
- Practical no-code strategy templates you can build today
- What does no-code algorithmic trading actually cost?
- Risks, realistic profitability expectations, and U.S. regulatory points
- How to choose a no-code algorithmic trading platform
- How Quantgenie supports the full build-to-deploy workflow
- Common pitfalls in no-code strategy building and how to avoid them
- When does no-code algorithmic trading actually make sense?
- Quantgenie gives you a faster path from idea to live strategy
- Sources
What is no-code algorithmic trading and how does it work?
Algorithmic trading, in the standard industry sense, means using a defined set of rules to automate trade entry, exit, and sizing decisions. Traditionally, implementing those rules required Python, C++, or a proprietary scripting language. No-code algorithmic trading replaces the code layer with a visual or conversational interface, so the rule logic stays the same but the implementation method changes.
The 2026 platform landscape shows four main interface types that have matured for non-programmers:
Drag-and-drop flow builders let you connect condition blocks (price crosses above a moving average, RSI drops below 30) to action blocks (buy X shares, set stop at YO). The logic is visual, which makes it easy to audit but can get cluttered for complex multi-condition strategies.
Template bots are pre-built strategy skeletons where you adjust parameters (lookback period, position size, stop-loss percentage) without touching the underlying logic. They’re the fastest way to get a working backtest running.
This approach is newer but increasingly capable.
AI-assisted code generation sits at the boundary of no-code and low-code. You describe intent, the platform generates code, and you deploy without editing it. The risk is opacity: if you can’t read the output, you can’t audit what the strategy actually does.
A few tasks still require manual setup regardless of interface: authenticating your broker API, configuring data subscriptions for less common instruments, and setting portfolio-level risk limits that span multiple strategies.
Pro Tip: Natural-language builders tend to produce more reproducible results than drag-and-drop flows because the translation step forces explicit rule documentation. If auditability matters to you (and it should before you go live), prefer a platform that shows you the exact rule set it generated from your description.
How to build a no-code trading strategy from idea to paper test
A strategy built without a clear hypothesis is just a curve-fitted backtest waiting to fail. Start with a specific, testable idea before you open any builder.
-
Define your hypothesis. Write one sentence: “Large-cap U.S. equities that gap up more than 1% at the open and hold above the prior day’s high by 10:00 AM tend to continue higher by the close.” That sentence tells you the market (large-cap U.S. equities), the timeframe (intraday), and the edge (gap-and-hold momentum).
-
Translate the hypothesis into explicit rules. Entry condition: price at 10:00 AM is above prior day’s high AND the open gap is greater than 1%. Exit condition: market close OR a 1.5% trailing stop, whichever triggers first. Position size: a small percentage of account equity per trade. Filter: exclude earnings days.
-
Encode the rules in the platform builder. Select your indicators (prior day’s high, percentage gap, trailing stop), set parameters, and connect conditions to actions. Keep the rule count low at first: three to five conditions is usually enough to define a real edge without overfitting.
-
Set up your backtest plan. Use multiple years of historical data. Reserve the most recent 20% of the data range as your out-of-sample test set and build only on the earlier 80%. Define slippage assumptions (a round-trip of $0.01–$0.05 per share is realistic for liquid U.S. equities) and include commission costs.
-
Run the in-sample backtest and log the results. Record the equity curve, maximum drawdown, trade count, win rate, and average trade duration. If the trade count is very low, the results are statistically thin regardless of how good the numbers look.
-
Run the out-of-sample test. If performance degrades sharply (Sharpe ratio drops by more than half, drawdown doubles), the strategy is likely overfit. Adjust the rules on the in-sample set only, then re-test out-of-sample once more.
-
Paper-trade for several weeks. Watch for execution surprises: fills that differ from backtest assumptions, data gaps, or orders that don’t trigger as expected.
Pro Tip: Deterministic builds matter more than most traders realize. A deterministic algorithm produces identical results every time you run it under the same conditions. If your backtest results change between runs without you changing the rules, you have a reproducibility problem that will make it impossible to trust forward performance.
Backtesting best practices and the metrics that actually matter
A backtest is a hypothesis test, not a profit guarantee. The settings you choose determine whether the test is honest.
Critical backtest settings:
- Data quality: Adjusted prices (accounting for splits and dividends) are mandatory for equity strategies. Point-in-time data matters for fundamental signals.
- Sample period: Longer is better, but include at least one full market cycle (bull and bear). For U.S. equities, 2007–2009 and 2020 are stress tests worth including.
- Slippage and commission: Model realistic transaction costs. Ignoring them can inflate CAGR by several percentage points on high-frequency strategies.
- Execution model: Assume fills at the open of the next bar after a signal, not at the exact signal price. Assuming instantaneous fills at signal price is one of the most common sources of backtest inflation.
The metrics that predict forward performance:
| Metric | What it tells you | Threshold to question |
|---|---|---|
| CAGR | Annualized return | Meaningless without drawdown context |
| Max drawdown | Worst peak-to-trough loss | Above 25% is hard to hold through live |
| Sharpe ratio | Return per unit of volatility | Below 1 suggests weak risk-adjusted edge |
| Sortino ratio | Return per unit of downside volatility | Better than Sharpe for asymmetric strategies |
| Win rate | Percentage of profitable trades | Low win rate is fine if average win >> average loss |
| Expectancy | Average profit per trade (wins and losses combined) | Negative expectancy means the strategy loses money on average |
| Trade frequency | Trades per month | Too few trades = statistically unreliable results |
Walk-forward testing is the most honest robustness check available without live data. You divide the full data range into rolling windows, optimize on each in-sample window, and test on the following out-of-sample window. A strategy that holds up across multiple walk-forward windows is far more likely to survive live trading than one optimized on a single period.
Survivorship bias is one of the most underappreciated problems in retail backtesting. If your data set includes only stocks that are currently trading, you’re missing every company that went bankrupt or was delisted during your test period. That omission makes momentum and trend strategies look better than they are, because the worst outcomes are simply absent from the data.
The global algorithmic trading market was projected to surpass $21,685.53 million by 2026, which has driven significant investment in higher-quality data feeds and backtesting infrastructure. This market growth is part of why institutional-grade data is now accessible to retail traders through no-code platforms rather than only through expensive direct data vendor contracts.
How to go live: broker integrations, execution, and monitoring
Moving from paper trading to live execution is where most traders underestimate the operational complexity. The strategy logic is the same; the failure modes are different.

Broker connectivity: Most no-code platforms connect to brokers through API keys with defined permission scopes. You’ll typically need to enable trading permissions (not just read-only data access) and set IP whitelisting if your broker supports it. Custodial models, where the platform holds credentials and routes orders on your behalf, are simpler to set up but introduce a counterparty dependency. Broker-execution models, where the platform sends orders directly to your brokerage account, give you more control and clearer audit trails.
Execution behavior to expect: Live fills rarely match backtest assumptions exactly. Limit orders may not fill during fast markets. Market orders on thinly traded instruments can move the price against you. Partial fills are common on larger orders and require your strategy to handle them gracefully (most no-code platforms do this automatically, but confirm it before going live).
Monitoring and fail-safes to set up before day one:
- Equity alerts: notify you if account value drops more than X% in a session.
- Open order monitoring: flag any order that has been open longer than expected.
- Heartbeat checks: confirm the strategy is still running and connected.
- Kill-switch: a manual or automatic mechanism to cancel all open orders and flatten positions immediately.
- SMS or push alerts for critical events (Quantgenie’s launch notification workflow supports this type of alerting).
Go-live readiness checklist:
- Broker account funded and API permissions confirmed
- Position size limits set appropriately at the strategy level
- Maximum daily loss limit defined and enforced as a risk control
- Paper trading results reviewed and execution behavior understood
- Kill-switch tested in a sandbox environment
The first month of live trading: Treat them as extended paper trading with real money at minimum viable size. Don’t scale position sizes until you have at least 20 live trades that match the backtest’s behavioral profile (similar win rate, similar average trade duration). Scale in moderate increments of current size, not all at once.
Practical no-code strategy templates you can build today
These strategy cards are starting points for paper trading, not finished products. Each one is simple enough to build in a no-code interface in under an hour.
-
Moving-average crossover (trend following): Buy when the 10-day EMA crosses above the 50-day EMA; sell when it crosses back below. Works best on daily charts for liquid ETFs like SPY or QQQ. Use a 1.5x ATR trailing stop. Avoid during sideways, low-volatility regimes where crossovers generate excessive whipsaws.
-
Momentum breakout: Buy when price closes above the 20-day high on above-average volume; exit at the 10-day low or a fixed 5% stop. Best suited to trending markets and individual large-cap stocks. Position size: 2% of equity per trade, maximum five positions.
-
Mean reversion (RSI-based): Buy when RSI(14) drops below 30 on a stock that is above its 200-day moving average (the long-term trend filter is critical). Exit when RSI crosses back above 50 or after five trading days, whichever comes first. Works better in range-bound markets than in strong downtrends.
-
Volatility breakout: Buy when today’s range exceeds 1.5x the 10-day average true range and price closes in the top 25% of the day’s range. Exit at the next day’s open. Short holding period means transaction costs matter significantly; use only on liquid instruments.
-
ETF rebalancing: Hold a fixed allocation across two to four non-correlated ETFs (e.g., equities, bonds, gold). Rebalance monthly when any position drifts more than 5% from its target weight. Low trade frequency makes this one of the easiest strategies to run live with minimal monitoring.
-
Simple pairs (sector ETF rotation): Rank a set of sector ETFs by 3-month momentum each month. Hold the top two; exit the bottom two. Rebalance monthly. The edge comes from relative strength, not market direction, which makes it more regime-neutral than pure trend strategies.
What does no-code algorithmic trading actually cost?
Cost has three components: platform access, market data, and execution. Understanding each separately prevents budget surprises.
Platform subscription: Entry-level no-code platforms often offer a free or trial tier with limited backtesting history or strategy count. Paid plans for individual traders typically run $30–$150 per month depending on data access, backtest depth, and broker integrations. Institutional-tier access with full historical data and multi-strategy portfolios can run higher.
Market data: Some platforms bundle historical data in the subscription; others charge separately. Real-time data for U.S. equities is often included through broker connectivity (your brokerage provides the feed). Premium data (point-in-time fundamentals, options chains, alternative data) adds cost and is rarely necessary for simple rule-based strategies.
Execution fees: Standard U.S. equity commissions at major retail brokers are now effectively zero for market and limit orders on stocks and ETFs. Options strategies carry per-contract fees (typically $0.50–$0.65 per contract at major U.S. brokers). High-frequency strategies that trade dozens of times per day will feel these costs even at zero-commission brokers through bid-ask spread impact.
Realistic cost scenarios:
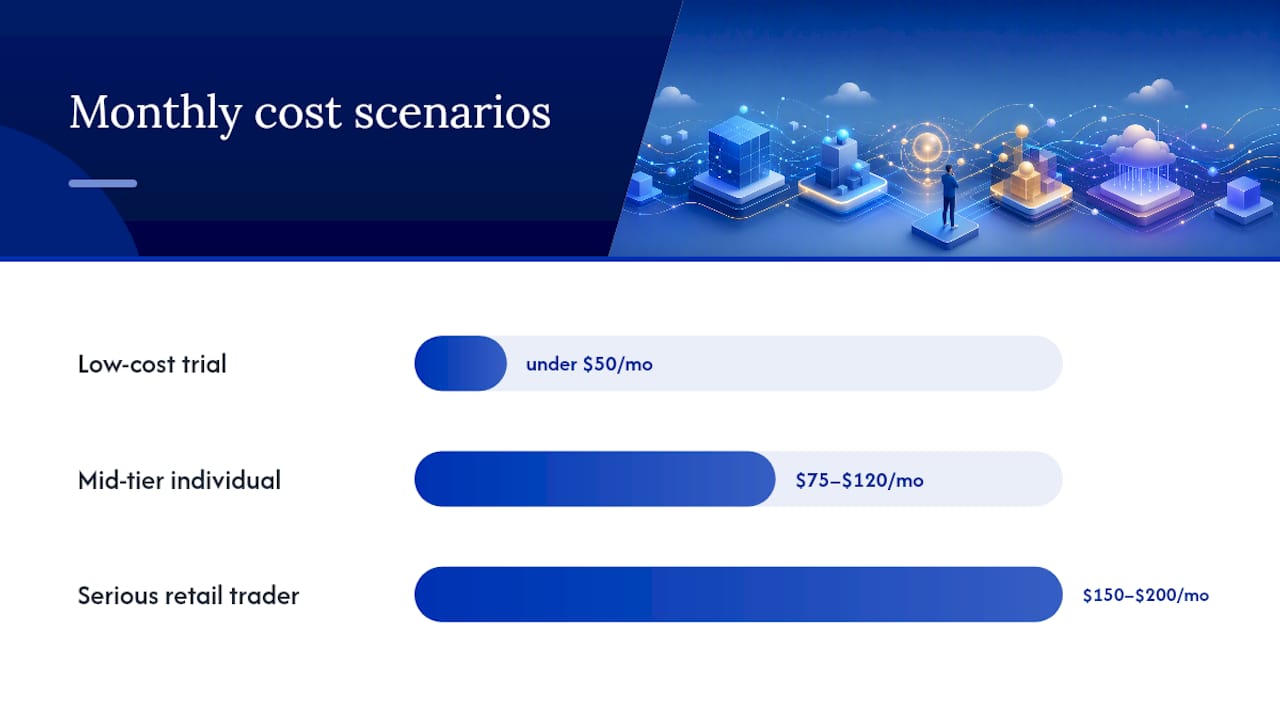
- Low-cost trial: Free or $30/month platform tier, broker data feed, zero-commission broker. Total monthly cost: under $50.
- Mid-tier individual trader: $75–$100/month platform subscription with full historical data and one to two broker integrations. Total monthly cost: $75–$120.
- Serious retail trader: $100–$150/month platform with institutional data, multiple strategies, and portfolio-level risk tools. Total monthly cost: $150–$200 before execution costs.
Timeline from idea to live:
- Prototype build: 1–4 hours
- Robust backtest with walk-forward: 2–5 days
- Paper trading validation: 2–4 weeks
- Limited live test: 30 days minimum before scaling
Compressing the timeline is possible by starting with a template strategy rather than building from scratch, and by using a platform that provides pre-validated institutional data so you’re not debugging data quality issues during backtesting.
Risks, realistic profitability expectations, and U.S. regulatory points
Most backtests look better than live performance. The gap is real, consistent, and worth understanding before you commit capital.
Why backtests overstate live returns: Transaction costs are often underestimated. Slippage assumptions are optimistic. Strategies are implicitly fit to the historical period even when you try to avoid it. Market regimes shift. A strategy that worked on 2015–2020 data may face a structurally different market in 2025–2026.
Main risks in live algorithmic trading:
- Execution risk: Orders don’t fill at expected prices, especially during news events or low-liquidity periods.
- Model drift: The market conditions that made a strategy profitable change over time. A momentum strategy that worked in a trending market may generate losses in a choppy one.
- Regime changes: Volatility spikes, correlation breakdowns, and macro shifts can invalidate assumptions baked into a strategy’s parameters.
- Concentration risk: Running a single strategy on a single instrument amplifies all of the above.
The uncomfortable truth about retail algorithmic trading is that most strategies that look profitable in backtesting don’t survive their first year of live trading. That’s not an argument against building them. It’s an argument for treating every live strategy as a hypothesis under continuous test, not a finished product.
U.S. regulatory considerations: The SEC and FINRA regulate algorithmic trading activity. Retail traders using no-code platforms to trade their own accounts are generally not subject to the same reporting requirements as registered investment advisers or broker-dealers, but a few rules apply regardless. The Pattern Day Trader (PDT) rule requires a minimum $25,000 account balance for accounts that execute four or more day trades in five business days. Strategies that trade frequently on margin need to account for this. If you’re managing money for others using an algorithm, you likely need to register as an investment adviser. This is general information, not legal or financial advice; confirm your specific situation with a qualified professional.
Risk mitigation checklist:
- Set a maximum position size per trade (2% of equity is a common starting point)
- Define a maximum daily loss limit that triggers automatic shutdown
- Revalidate strategy performance quarterly against live results
- Run walk-forward tests before any parameter change
- Never run a strategy live that you can’t explain in plain English
How to choose a no-code algorithmic trading platform
The right platform depends on your goals, not on which one has the most features. A trader learning the process needs different things than one managing a live portfolio.
Selection criteria:
- Interface type: Does it match how you think? Visual builders suit traders who prefer seeing logic as a flowchart. Natural-language builders suit traders who can articulate rules precisely in words.
- Determinism and repeatability: Does the platform produce identical backtest results on repeated runs? Non-deterministic engines make it impossible to isolate the effect of a rule change.
- Backtest engine fidelity: Does it model slippage, partial fills, and commission? Does it use adjusted historical prices? Can you specify execution timing (next-bar open vs. signal bar close)?
- Data sources: What historical data is included? How far back does it go? Is it adjusted for corporate actions?
- Broker integrations: Does it connect to your broker? What order types does it support?
- Security: How are API keys stored? Is data encrypted in transit and at rest? What happens to your strategy data if you cancel?
- Support and documentation: Is there a community, tutorial library, or responsive support team?
- Pricing: Does the cost scale with usage, or is it a flat subscription?
Interface type tradeoffs:
| Interface type | Best for | Tradeoffs |
|---|---|---|
| Drag-and-drop visual builder | Traders who prefer visual logic maps | Can get complex quickly; harder to document |
| Template bots | Beginners learning the process | Limited customization; may not fit your edge |
| Natural-language builder | Traders who can articulate rules clearly | Requires precise language; translation must be auditable |
| AI-assisted code generation | Low-code users comfortable reviewing output | Opacity risk if output isn’t readable |
How to weight criteria by goal:
For learning: prioritize interface clarity, template availability, and paper trading support over data depth or broker integrations. For live trading: prioritize backtest fidelity, determinism, broker connectivity, and security. For scaling: prioritize portfolio-level risk tools, multi-strategy management, and institutional data quality.
A lightweight scoring approach: rate each platform 1–5 on your top five criteria, weight each criterion by importance to your current goal, and sum the scores. The platform with the highest weighted score is your trial candidate, not necessarily the one with the most impressive marketing.
How Quantgenie supports the full build-to-deploy workflow
Quantgenie is built specifically for traders who want to go from idea to live algorithm without touching code. The platform’s core workflow maps directly onto the build-test-deploy process described in this article.
Key no-code capabilities:
- Natural-language strategy translation: Describe your entry and exit rules in plain English; Quantgenie translates them into a deterministic algorithm that produces identical results on every run.
- Visual drag-and-drop editor: For traders who prefer a flowchart-style interface, the visual builder lets you connect conditions and actions without writing logic manually.
- Institutional-grade backtesting: Historical data covers the depth and quality needed for honest out-of-sample testing, including adjusted prices and realistic execution modeling.
- AI-assisted backtest analysis: After a backtest runs, you can ask the platform questions about the results in plain English (“What drove the largest drawdown?” or “How does performance change if I tighten the stop?”).
- Portfolio risk analysis: View strategy performance in the context of a multi-strategy portfolio, not just in isolation.
- Broker integrations: Connect directly to supported U.S. brokers for paper trading and live execution without leaving the platform.
Example workflow on Quantgenie:
- Describe your strategy in plain English on the build page.
- Review the generated rule set and adjust parameters in the visual editor.
- Run a backtest with institutional data and review performance metrics.
- Paper-trade the strategy through the broker integration.
- Deploy live with position limits and monitoring alerts active.
On security: Quantgenie uses encrypted data transmission and stores API credentials with access controls. Strategy data belongs to the user, not the platform.
Common pitfalls in no-code strategy building and how to avoid them
The no-code interface removes the coding barrier but doesn’t remove the analytical discipline required to build a strategy that works.
Overfitting to historical data is the most common failure mode. It happens when you adjust parameters repeatedly until the backtest looks good, without reserving any data to test whether those parameters generalize. The fix is strict: define your out-of-sample test set before you start building, and don’t touch it until you’re done optimizing.
Ignoring transaction costs produces strategies that look profitable in backtesting but lose money live. A strategy that trades 50 times per month with a $0.01 average slippage per share on 100-share positions loses $50/month to slippage alone, before commissions. Model costs explicitly, not optimistically.
Using unadjusted price data for equity strategies distorts every indicator that uses price history. Always confirm your data is adjusted.
Building strategies with too few trades produces results that look statistically meaningful but aren’t. A backtest with 15 trades over five years has a confidence interval so wide that the results are essentially noise. Aim for at least 30 trades in the backtest period; 100+ is better.
Treating the first backtest as the final answer is a process failure. A single backtest is a starting point. Walk-forward testing, out-of-sample validation, and paper trading are the steps that separate a real edge from a lucky historical fit.
Neglecting regime awareness leads traders to deploy strategies in market conditions they weren’t designed for. A mean-reversion strategy built on 2010–2019 data may have been implicitly calibrated to low-volatility, low-rate conditions. Running it in a high-volatility, rising-rate environment without adjustment is a regime mismatch, not a strategy failure.
When does no-code algorithmic trading actually make sense?
No-code tools have genuinely lowered the barrier to systematic trading, and that’s worth acknowledging plainly. But the tools don’t change the underlying difficulty of finding a real edge in the market.
The traders who get the most out of no-code platforms tend to share a few traits: they have a clear, testable hypothesis before they open the builder; they treat backtesting as a falsification exercise rather than a search for impressive numbers; and they’re willing to paper-trade long enough to be genuinely surprised by execution behavior before committing capital.
No-code makes the most sense for systematic hobbyists who want to test rule-based ideas without hiring a developer, and for advisors or small fund managers with modest AUM who need repeatable, auditable strategies without a full quant team. It’s a poor fit for complex multi-asset strategies that require custom execution logic, or for latency-sensitive approaches where microseconds matter. For those use cases, the abstraction layer that makes no-code accessible is also what makes it inadequate.
The honest guidance: use no-code to learn the process and validate ideas. If a strategy survives rigorous backtesting and paper trading, the no-code platform that built it is good enough to run it live. Don’t let the simplicity of the interface make you skip the hard analytical work. The interface is easier; the market isn’t.
Quantgenie gives you a faster path from idea to live strategy
If you’ve read this far, you have a clear picture of what the build-test-deploy process requires. Quantgenie is built to support exactly that process, without the friction of learning a programming language or managing a separate data pipeline.
The sharpest advantage Quantgenie offers retail traders is the combination of natural-language strategy translation and deterministic algorithm generation. You describe your rules in plain English on the Quantgenie build page, the platform generates an auditable algorithm that runs identically every time, and you backtest it against institutional-grade historical data before a single dollar is at risk. That’s a workflow that used to require a quant developer and a data vendor contract.
A good first step: describe a simple moving-average crossover or momentum breakout strategy in plain English, run the backtest, and use the AI-assisted analysis to understand what drove the results. Paper-trade it for two weeks. You’ll learn more about execution behavior in those two weeks than in months of reading about it.
Visit Quantgenie to start building your first strategy today.
Sources
This article is general information, not a substitute for advice from a qualified financial advisor. Consult a qualified financial professional about your own circumstances before acting on anything here.