
Risk of Ruin for Traders: Calculate Your Odds

Risk of ruin is the probability that your trading or gambling capital falls below a threshold from which recovery becomes impossible. Calculate it now using your win rate, reward-to-risk ratio, and risk per trade. If the result exceeds 5%, reduce your position size before placing another trade.
Two numbers anchor every serious risk conversation:
- Risk per trade: Risk managers target 1–2% of account capital per position. At this level, a well-designed strategy’s risk of ruin approaches zero.
- Ruin probability target: Institutional traders aim for a risk of ruin below 1% over their planning period. Retail traders should reduce size if risk of ruin rises above 5%. Anything above 10% is generally considered high risk and requires an immediate reduction.
The concept applies equally to a day trader sizing equity positions, a poker player managing a bankroll, and a systematic fund manager running a multi-strategy portfolio. The math is the same. What changes is the threshold you define as “ruin.”
Table of Contents
- What is risk of ruin, and where does the concept come from?
- How to calculate risk of ruin: formulas and a worked example
- How to read your risk-of-ruin result
- Risk of ruin vs. drawdown: why you need both numbers
- Six practical controls that actually lower your risk of ruin
- Which tools help you calculate risk of ruin quickly?
- Why deterministic backtesting makes RoR estimates more reliable
- Key Takeaways
- The part most traders get wrong about survival math
- Quantgenie turns your strategy into a reproducible RoR estimate
- Useful sources and calculators
What is risk of ruin, and where does the concept come from?
Risk of ruin is a forward-looking probability: given your current edge, bet size, and capital, what are the odds you eventually hit a loss deep enough to stop trading permanently? It is not a measure of a single bad trade. It is a measure of whether your strategy can survive the full distribution of outcomes it will produce over time.
The concept originates in gambler’s ruin theory, a branch of probability mathematics formalized in the 17th century. The gambler’s ruin random walk/12%3A_Random_Walks/12.02%3A_Gambler%27s_Ruin) shows that a player with a negative expected value will reach ruin with certainty, regardless of betting system. Even with a positive edge, ruin remains possible if the bet size is large enough relative to the bankroll.
Where RoR applies:
- Fixed-fraction position sizing in equities, futures, or forex
- Discrete-bet gambling with a defined bankroll (poker, sports betting)
- Single-strategy backtesting and forward-testing horizons
- Portfolio-level risk assessment when strategies are isolated and independently sized
Where it is less useful:
- Complex multi-asset portfolios with correlated positions and dynamic rebalancing
- Strategies with highly variable payoff distributions that a binary formula cannot capture
A simple preview: imagine flipping a coin where heads pays $1.50 and tails costs $1.00. Your edge is positive. But if you bet 40% of your bankroll each flip, a short losing streak wipes you out before the edge materializes. That is the core problem RoR quantifies.
How to calculate risk of ruin: formulas and a worked example
The closed-form approximation
The most widely used simplified formula for binary-outcome strategies is:
RoR = ((1 - Edge) / (1 + Edge))^U
Where:
- p = win probability
- q = loss probability (1 - p)
- Edge = (p × R) - q, where R is the reward-to-risk ratio
- U = units to ruin = ruin threshold ÷ risk per trade (expressed as a fraction of capital)
This formula assumes fixed fractional sizing, independent trades, and a stationary edge. Violate any of those assumptions and the output becomes unreliable. Use it as a quick directional check, not a final answer.
Worked example: step by step
Inputs:
- Win rate (p): 0.55
- Loss rate (q): 0.45
- Reward-to-risk ®: 1.5
- Risk per trade: 2% of capital
- Ruin threshold: 50% drawdown
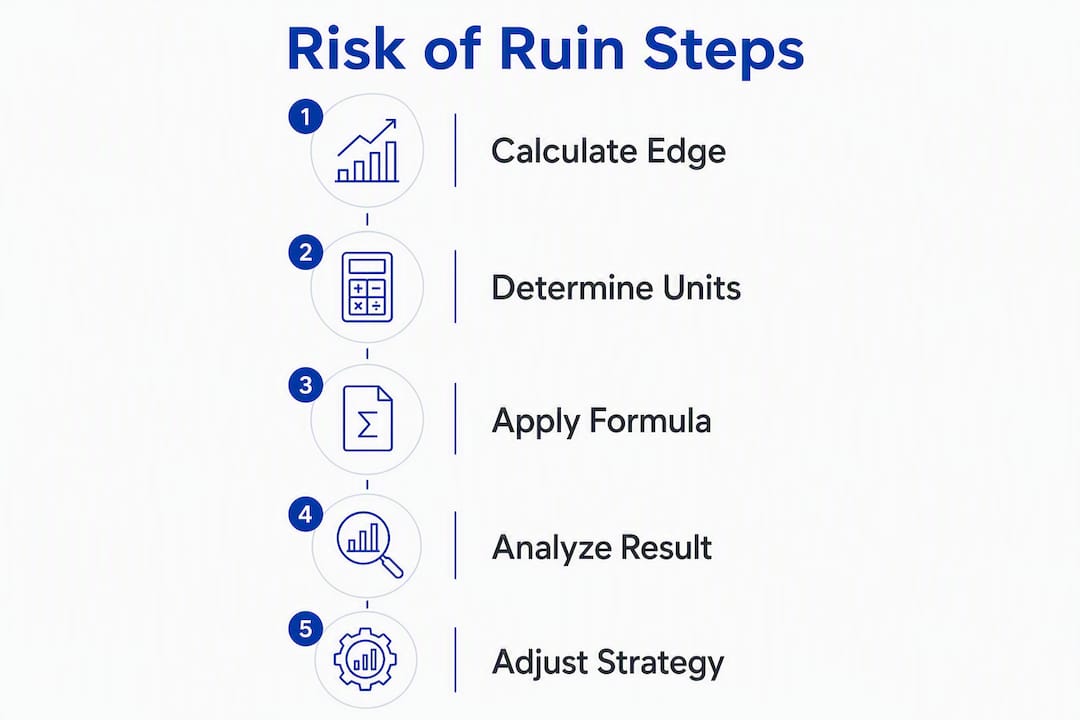
Step 1: Calculate edge. Edge = (0.55 × 1.5) - 0.45 = 0.825 - 0.45 = a positive number
Step 2: Calculate units to ruin. U = a ruin threshold divided by risk per trade (expressed as a fraction of capital)

Step 3: Apply the formula. RoR = ((1 - Edge) / (1 + Edge)) raised to power U gives a very low risk of ruin
Increasing the risk per trade to a high fraction drastically increases the risk of ruin. That is the non-linear effect of position sizing in action.
Statistic callout: Limiting risk per trade to 1–2% of capital reduces ruin probability exponentially compared with aggressive 5–10% sizing, even when win rate and edge remain identical.
When to use Monte Carlo instead
The closed-form formula breaks down when your trades have variable payoffs, non-binary outcomes, or serial correlation (winning trades clustering together, for example). Monte Carlo simulation with 5,000–10,000 shuffles of real trade results produces a more reliable estimate. You need at least 100 completed trades to build a representative distribution before the simulation means anything.
How to plug values into a calculator:
- Gather your last 100+ trades: win rate, average win size, average loss size.
- Enter win rate, R:R ratio, risk per trade (%), and ruin threshold (%) into an online RoR calculator.
- Note the output. If it exceeds 5%, reduce risk per trade before re-running.
- Cross-check with a Monte Carlo tool using the same trade history for a more realistic picture.
How to read your risk-of-ruin result
A raw percentage only becomes useful when you know what to do with it.
Concrete interpretation:
- RoR < 1%: Institutional-grade. Your sizing is conservative enough that ruin over a normal trading horizon is a tail event.
- RoR 1–5%: Acceptable for most retail traders. Monitor closely and run sensitivity checks quarterly.
- RoR 5–10%: Elevated. Reduce risk per trade immediately. A losing streak of realistic length can still reach your ruin threshold.
- RoR > 10%: High risk by professional standards. Stop trading at current size, rebuild edge evidence, and resize down.
Practical decision rules:
- If RoR > 5%: cut risk per trade by half and recalculate.
- If RoR > 10%: pause live trading, review strategy edge with fresh data, and do not return to full size until RoR drops below 5%.
- If your account size forces minimum trade sizes that push risk per trade above 2% (common with PDT-rule constraints on small accounts), treat that as a structural warning.
Pro Tip: Run a sensitivity table varying risk per trade from 0.5% to 5% while holding win rate and R:R constant. You will see exactly which input moves RoR most. In almost every case, reducing risk per trade is faster and more reliable than trying to improve win rate by a few percentage points.
The psychological dimension matters too. A trader who cannot tolerate a 20% drawdown psychologically will abandon a strategy before ruin ever becomes a mathematical event. Set your ruin threshold at the drawdown level where you would genuinely stop trading, not at zero.
Risk of ruin vs. drawdown: why you need both numbers
These two metrics measure different things, and confusing them leads to bad sizing decisions.
The core distinction:
- Drawdown is backward-looking: the observed peak-to-trough decline in your equity curve. It tells you what already happened.
- Risk of ruin is forward-looking: the probability of a future decline severe enough to end trading. It tells you what could happen.
Why both matter:
- A 25% drawdown sounds survivable. But recovering from it requires a 33% gain on the reduced capital. A 50% drawdown requires a 100% gain. The recovery math is non-linear, and it gets brutal fast.
- Drawdown tells you the cost of past losing streaks. RoR tells you the probability of a future streak that exceeds your recovery capacity.
How they interact: A strategy with a high RoR will eventually produce a drawdown large enough to trigger ruin. Tracking drawdown in real time gives you an early warning: if live drawdown is approaching the threshold you used in your RoR calculation, your model assumptions may be wrong and it is time to resize.
Think of drawdown as the speedometer and RoR as the probability of a crash. You need both on the dashboard.
Six practical controls that actually lower your risk of ruin
1. Fixed-fraction position sizing at 1–2% per trade
This is the single most effective lever. Small increases in percent risked per trade produce disproportionately large increases in RoR. Going from 2% to 5% risk per trade does not increase ruin probability by 2.5x. It can increase it by an order of magnitude, depending on your edge.
2. Fractional Kelly sizing
Full Kelly maximizes long-run growth but produces drawdowns most traders cannot stomach. A quarter-Kelly or half-Kelly fraction (0.25–0.5 of the Kelly-optimal bet) cuts drawdown volatility significantly while preserving most of the growth benefit. Most practitioners use fractional Kelly as a ceiling, not a target.
3. Hard stop-loss and daily max-loss rules
A stop-loss tied to the strategy’s expected volatility, not to an arbitrary dollar amount, keeps individual losses within the model’s assumptions. A daily max-loss rule (e.g., stop trading if you lose 3× your average daily risk) prevents emotional revenge trading from compounding a bad day into a catastrophic one.
4. Diversification across uncorrelated strategies
Running two or three strategies with low return correlation reduces the probability that all of them hit losing streaks simultaneously. Keep a cash buffer outside the trading account so a single strategy’s drawdown cannot force you to liquidate positions in another.

5. Reduce size when live edge degrades
Even profitable strategies can go to ruin if position sizing stays large during a period when the edge is temporarily absent. Require a minimum of 100+ live trades before trusting a win-rate estimate, and cut size by half if live performance diverges materially from backtested expectations.
6. Leverage caps
Leverage amplifies variance and shrinks the effective number of capital units to ruin, which drives RoR up non-linearly. A 10:1 leveraged position on a 2% risk-per-trade account is not a 2% risk trade. Cap leverage before applying any other sizing rule.
Pro Tip: The fastest path to a lower RoR is always the same: reduce percent risk per trade. Diversification and stop rules are secondary defenses. Get the sizing right first.
Which tools help you calculate risk of ruin quickly?
Online calculators:
- Myfxbook risk-of-ruin calculator: Forex-focused, requires win rate, risk per trade, and number of consecutive losses to ruin. Fast for a directional check.
- Investopedia’s RoR explainer: Best starting point for definitions and formula context before you run numbers.
- GamblingCalc and similar bankroll calculators: Useful for fixed-bet gambling scenarios with defined odds.
Spreadsheet templates:
Build a simple two-column table: vary risk per trade from 0.5% to 10% in column A, calculate RoR in column B using the closed-form formula. The resulting curve shows you exactly where your current sizing sits on the ruin probability spectrum.
Monte Carlo simulators:
For strategies with variable payoffs or non-binary outcomes, a Monte Carlo tool that shuffles your actual trade history is more reliable than any formula. Use at least 100 trades as input and run 5,000–10,000 simulation passes to get a stable estimate.
When to use which:
- Formula calculator: quick sanity check on a new strategy before backtesting.
- Monte Carlo: after you have real trade data and need a realistic forward estimate.
- Deterministic backtest platform: when you need reproducible results tied to validated market data.
For readers building rules-based strategies with defined risk parameters, a structured risk-management framework helps translate RoR outputs into concrete position-sizing rules.
Why deterministic backtesting makes RoR estimates more reliable
A formula gives you a number. A deterministic backtest gives you a distribution.
The difference matters because real trading strategies do not produce binary, independent, identically distributed outcomes. They produce sequences of trades with variable sizes, correlated results, and regime-dependent edges. A closed-form RoR formula cannot capture any of that. Monte Carlo combined with deterministic backtesting captures non-binary payoffs, fat tails, and serial correlation in ways the formula simply cannot.
The workflow:
- Run a deterministic backtest on validated historical data to generate your actual trade distribution (win rate, average win, average loss, trade sequence).
- Feed that distribution into a Monte Carlo simulator running 5,000–10,000 shuffles.
- Inspect the output: what percentage of simulated equity curves hit your ruin threshold? What does the max drawdown distribution look like? What is the expected time-to-ruin in the worst decile?
What to look for in the output:
- Percent of simulated curves hitting ruin (your true forward RoR estimate)
- Max drawdown distribution across all simulations
- Median and worst-decile equity curve paths
- Expected time-to-ruin in adverse scenarios
Deterministic backtesting matters because reproducibility is the foundation of a trustworthy RoR estimate. If two runs of the same strategy on the same data produce different trade sequences, you cannot know whether a low RoR reflects genuine edge or lucky simulation variance. Validated, repeatable algorithms eliminate that ambiguity.
Platforms like Quantgenie run deterministic backtests on institutional-grade market data, which means the trade distribution you feed into Monte Carlo reflects what the strategy actually did, not a random artifact of how the backtest engine handled order fills. Validate your inputs and assumptions before trusting any output, regardless of the platform.
Key Takeaways
Risk of ruin below 1% is the institutional standard; retail traders should treat anything above 5% as a signal to reduce position size immediately, and anything over 10% as high risk demanding immediate reduction.
| Point | Details |
|---|---|
| Define your ruin threshold | Set the drawdown level where you would genuinely stop trading, then calculate RoR against that number. |
| Keep risk per trade at 1–2% | At this level, a positive-edge strategy’s ruin probability approaches zero; sizing is the fastest lever. |
| Use Monte Carlo for real estimates | Run 5,000–10,000 simulation passes on 100+ actual trades for a reliable forward RoR figure. |
| Institutions target RoR below 1% | For most retail traders, an RoR below 5% is acceptable; above 10% is high risk and requires immediate reduction. |
| Quantgenie for deterministic backtests | Quantgenie translates strategy rules into reproducible algorithms, giving you a validated trade distribution to feed into Monte Carlo RoR estimates. |
The part most traders get wrong about survival math
The conventional wisdom says find a good edge and the math takes care of itself. That is backwards.
Edge is necessary but not sufficient. A strategy with a 55% win rate and a 1.5:1 reward-to-risk ratio is genuinely profitable over thousands of trades. But run it at 10% risk per trade and a realistic losing streak of 8–10 consecutive losses, which any strategy will eventually produce, can cut the account in half before the edge has time to show up in the results. The sequence of outcomes is the decisive factor, not the long-run average.
What experienced traders learn, usually after one painful lesson, is that survival is the prerequisite for everything else. You cannot realize an edge you are no longer funded to trade. The discipline to hold position size at 1–2%, enforce daily loss limits, and reduce size when live results diverge from backtested expectations is not conservative timidity. It is the mechanism that keeps you in the game long enough for the edge to compound.
The other underrated point: RoR is not a one-time calculation. Run it quarterly, or whenever your strategy’s live win rate or average R:R shifts materially. A strategy that had a 0.5% RoR six months ago may have a 7% RoR today if the edge has degraded and you have not adjusted sizing. The number is only as good as the inputs you feed it.
Quantgenie turns your strategy into a reproducible RoR estimate
Most traders calculate RoR once, with rough win-rate estimates, and never revisit it. The problem is that a formula is only as good as the trade distribution behind it, and most traders do not have a clean, validated one.
Quantgenie lets you describe your strategy in plain English and translates it into a deterministic algorithm that runs on institutional-grade market data. Every backtest produces the same trade sequence under the same conditions, which means the win rate, average R:R, and trade distribution you feed into a Monte Carlo RoR estimate are grounded in real, reproducible data rather than rough guesses. That gap between a formula-based estimate and a simulation-backed one is often the difference between a false sense of safety and an accurate picture of your actual ruin probability.
Build your first deterministic backtest on Quantgenie and run the Monte Carlo check before you size up. Validate your assumptions, check the data quality, and treat the output as a starting point for ongoing monitoring, not a one-time clearance.
Useful sources and calculators
- Risk of Ruin — Investopedia: Canonical definition, conceptual overview, and formula context. Start here if you are new to the metric.
- Gambler’s Ruin — LibreTexts/12%3A_Random_Walks/12.02%3A_Gambler%27s_Ruin): Academic treatment of the random-walk formulation and closed-form derivations. Useful for understanding the mathematical foundations.
- **Risk of Ruin Calculator — SatoshiMacro:** Trader-focused calculator with threshold guidance (institutional vs. retail benchmarks). Good for quick directional checks.
- Risk of Ruin — The Planet Indicator: Practitioner-level explainer covering Monte Carlo guidance, leverage impact, and the 1–2% per trade rule.
- Risk of Ruin Math — DayTradingToolkit: Beginner-accessible walkthrough of the closed-form formula and when to prefer simulation.
- Crypto Trading Strategy Template — StrategyArchive: Rules-based strategy template with trade review structure, useful for building the trade history needed for Monte Carlo inputs.
- Quantgenie Platform: Deterministic backtesting and no-code algorithm building for traders who need a validated trade distribution before running RoR estimates.